
Market Update | August 2026
Every month, we share the most important developments in the energy market. We explain how energy prices are determined, highlight trends over several months and years, and provide insight into how the market affects your energy bill.
The Energy Market in August
August brought plenty of solar energy and higher prices on the day-ahead market. Solar farms generated high levels of power and received an average of about €68/MWh. This accounts for 54% of the average day-ahead market price. With 58 hours of negative prices, the number remained comparable to recent months and below the 2025 level. Prices did not fall as deeply below zero. Onshore wind, on the other hand, had a quiet month: August was one of the least windy months of the past year. Nevertheless, the average price of €99/MWh remained high, at 80% of the average day-ahead market price. For batteries, opportunities were mainly in the day-ahead market, with stable price differentials of around €201/MWh. The imbalance market was erratic but less volatile. Control state 2 remained high and occurred in 41% of the quarter-hours.
1 | Solar Energy
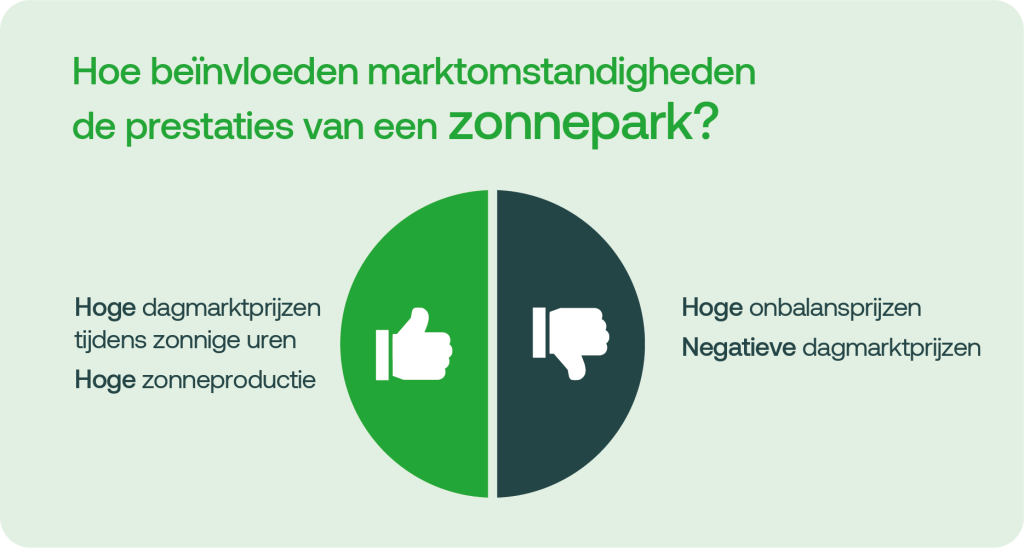
Do you generate solar energy? Then this update is for you. We’ll show you how this month’s energy prices have affected the earnings from solar installations.
1.1 | Volume and value of solar energy
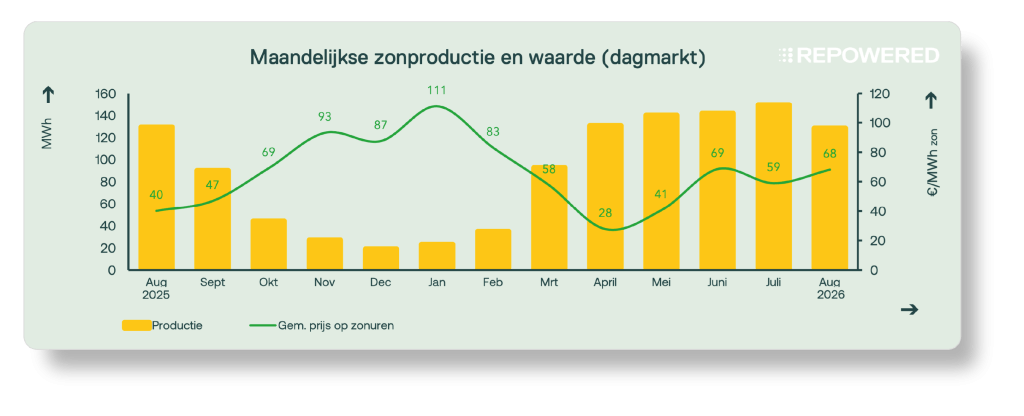
August was sunny throughout the Netherlands, with only a period of cloudier weather between approximately August 16 and 20. Solar power producers received an average of about €68/MWh—approximately 54% of the average daily market price of €125/MWh. During hours of sunshine, prices regularly dropped to close to €0/MWh and fell below zero for 58 hours. As a result, the value of solar energy was significantly higher than in August 2025. The main driver: the higher average price level on the day market this year.
1.2 | Negative prices
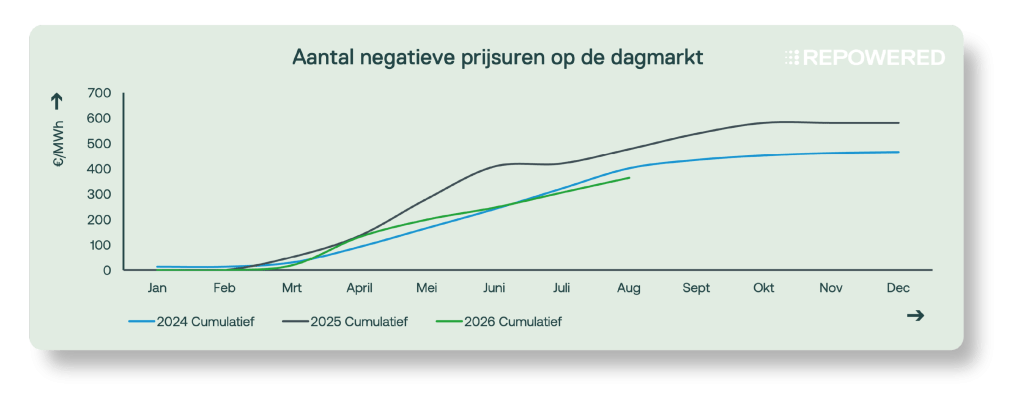
There were 58 hours of negative prices, consistent with the trend of previous months. Of these, 13 hours occurred during consecutive periods of more than six hours, causing some solar farms to lose their eligibility for the SDE subsidy. At the same time, negative prices remained relatively low: although prices regularly approached €0/MWh during sunny hours, they remained below zero only briefly and to a limited extent.
The fact that prices are hovering around €0/MWh may indicate that market participants are not offering all of their generation on the day-ahead market when conditions are unfavorable. For example, they may choose to temporarily reduce their generation or sell their energy on another market, such as the intraday market.
2 | Batteries
Do you have a battery? Then this update is for you. We’ll show you how this month’s energy prices have affected the earning potential of batteries.
2.1 | Day Market: Price Distribution
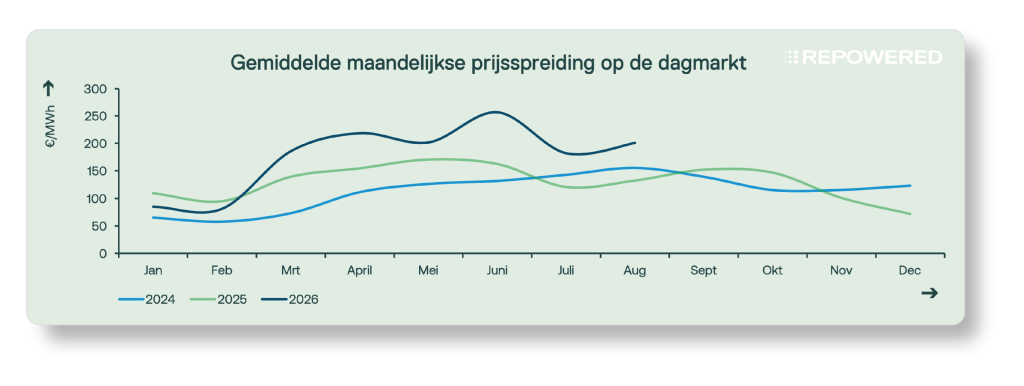
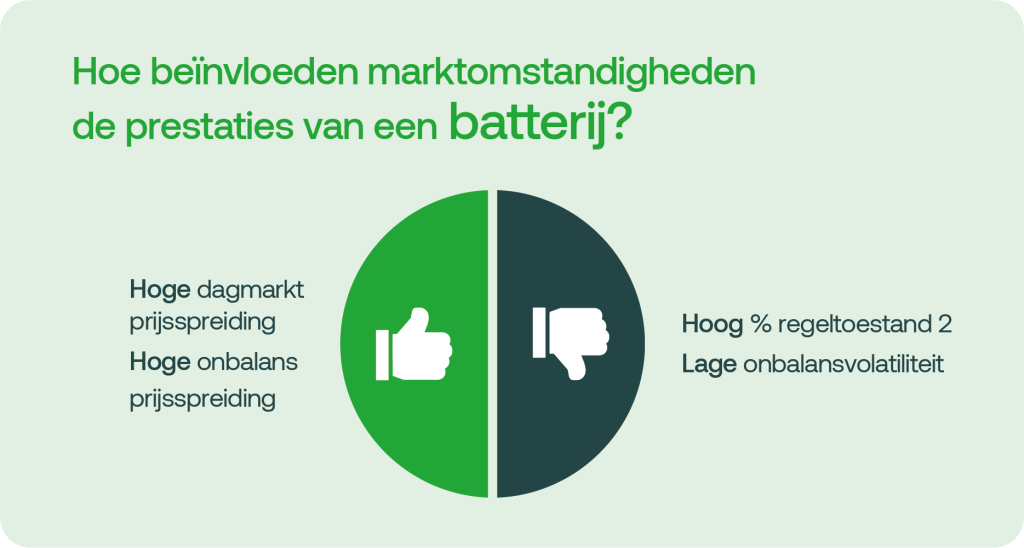
Arbitrage opportunities in the day-ahead market were comparable to last month and remained relatively stable throughout August. With an average price spread of approximately €201/MWh, the potential for batteries remained attractive. During the sunny afternoon hours, prices were often close to €0/MWh, while in the evening they regularly rose to around €200/MWh. As a result, evening prices were slightly higher than in previous months, with the exception of earlier periods of extreme heat.
The electricity market has clearly tightened in recent months. Higher gas prices—driven in part by increasing competition for gas—and European gas inventories below the seasonal average kept prices high. In addition, there was little wind in August, resulting in lower renewable energy production. Belgium also imported more electricity due to maintenance and outages at nuclear power plants, which increased demand in neighboring markets. Together, these factors kept spot market prices relatively high, despite strong solar generation during the afternoon hours.
2.2 | Imbalance Market: Price Dispersion
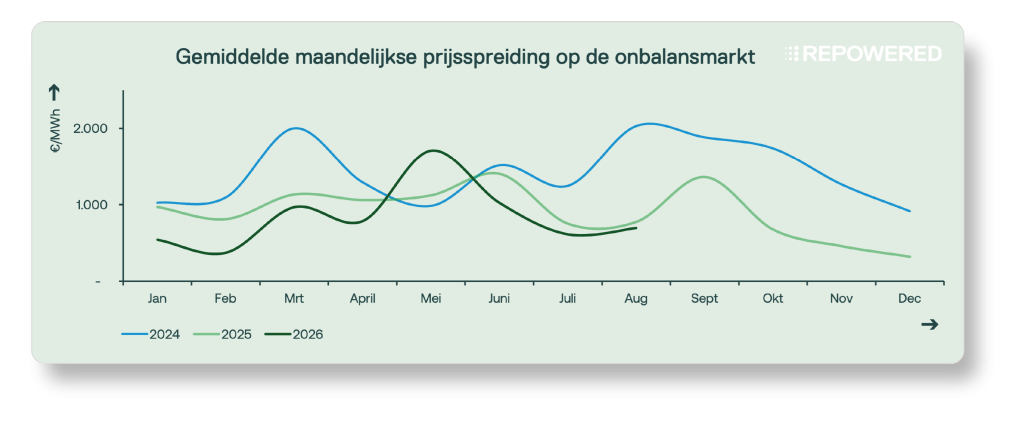
August once again offered fewer opportunities for batteries in the imbalance market. The average imbalance spread was comparable to July, but the market saw greater variations. On several days, there were price spikes without control state 2, which pushed up the daily spread. At the same time, on other days the system experienced a deficit, with a particular need for upward regulation rather than downward regulation. As a result, price differences on those days were actually smaller. Over the entire month, system deficits occurred about twice as often as system surpluses.
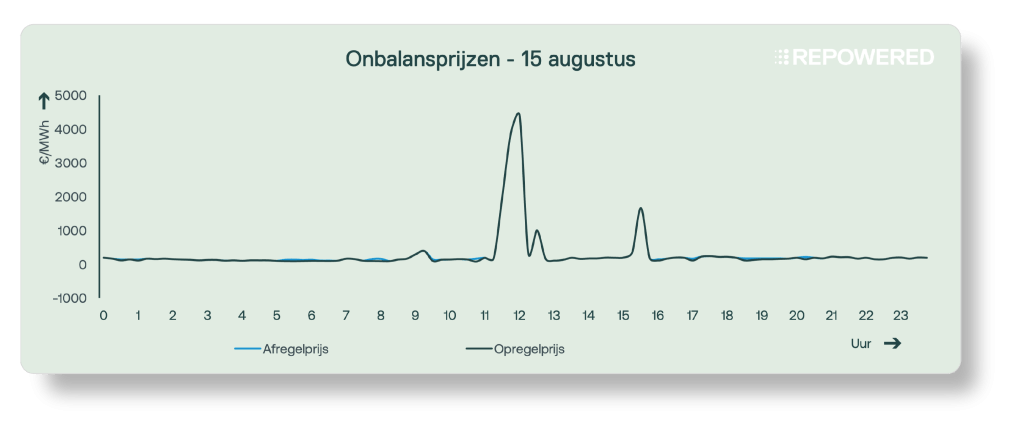
On August 15, 2026, the imbalance price skyrocketed to €4,400/MWh. This was the result of a major electricity shortage in the system.
Intraday market prices were relatively low, indicating that a significant amount of solar generation had been scheduled. However, as the day progressed, it became apparent that the solar forecasts had significantly overestimated actual generation. The resulting shortage of solar energy, combined with limited cross-border support from neighboring countries, forced the Dutch system operator to deploy large volumes of balancing energy. As a result, imbalance prices rose to exceptionally high levels. At that time, batteries were able to contribute to balancing by discharging and thus capitalizing on this high price.
2.3 | Imbalance Market: Control State 2
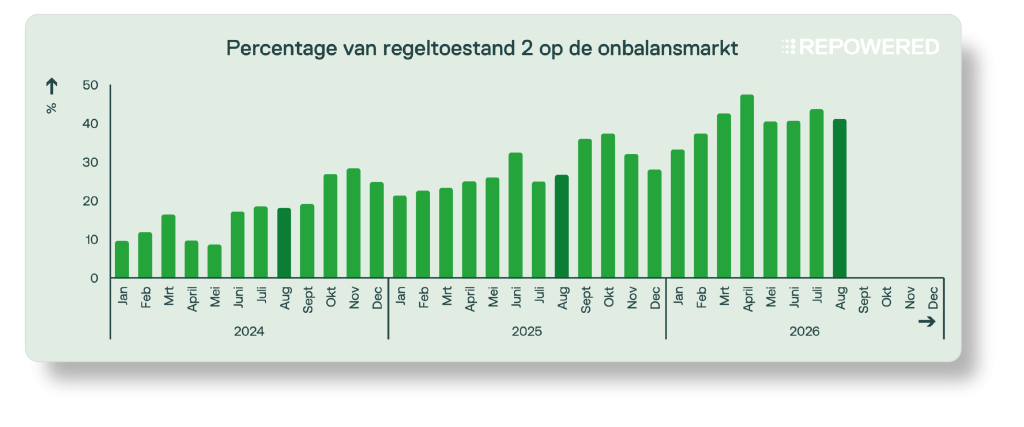
Balancing condition 2 occurred in approximately 41% of all quarter-hours in August, similar to previous months. This situation occurred primarily in the afternoon and evening. During these quarter-hours, the imbalance costs for market participants with an energy deficit (due, for example, to underproduction or higher-than-expected consumption) were at their highest, averaging about €150/MWh.
3 | Onshore Wind
Do you generate onshore wind energy? If so, this update is for you. We’ll show you how energy prices this month have affected the earnings of onshore wind farms.
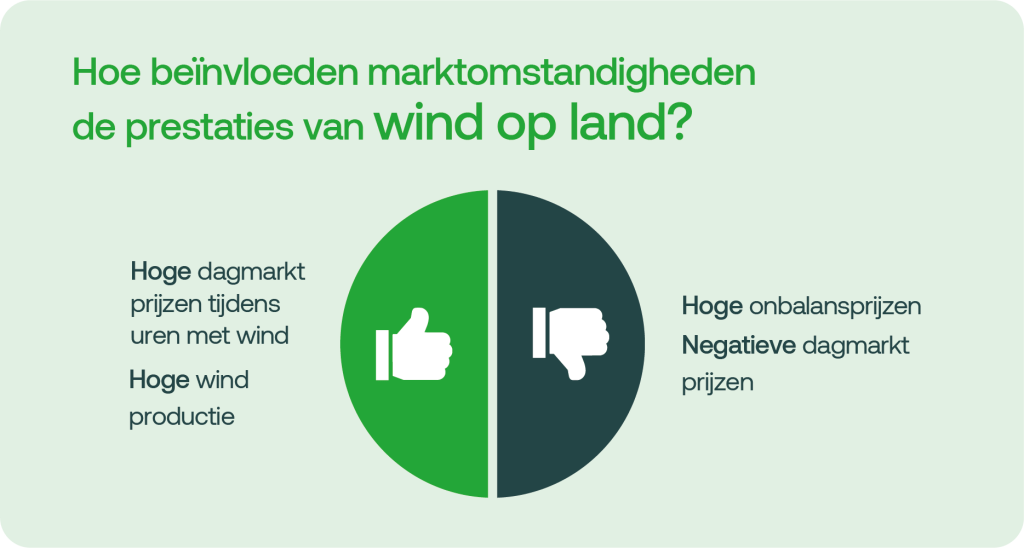
3.1 | Volume and Value of Wind Energy
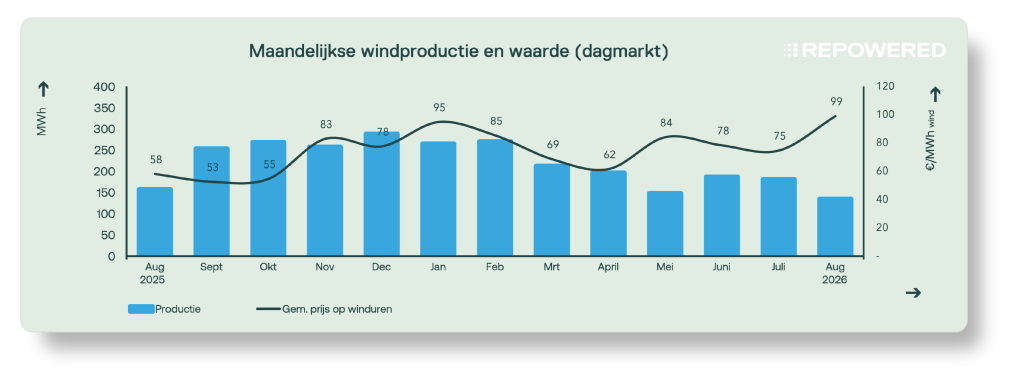
August was one of the least windy months of the past year. Wind generation increased mainly toward the end of the first and last weeks, particularly during the afternoon hours. Due to the limited wind generation, there was less renewable energy available, and reliance on thermal power plants increased. This contributed to the relatively high day-ahead market prices throughout the month.
Despite weaker wind conditions, the value of wind energy remained high: an average of €99/MWh. This is approximately 80% of the average day-ahead market price. The value was particularly high in the evening hours, with prices rising to nearly €200/MWh during the evening peak (6:00–8:00 p.m.). Even at night, the value regularly exceeded €100/MWh. As a result, the value of wind energy was higher than in June and July.
Would you like to receive the market update by email?
We'll send it to you every month.
Glossary
Feeling lost in technical jargon? We're here to help.