Market Update | March 2026
Every month, we share the most important developments in the energy market. We explain how energy prices are determined, highlight trends over several months and years, and provide insight into how the market affects your energy bill.
March: Sharp Contrasts in the Energy Market
Last month, there were stark contrasts in the energy market. The return of solar power drove prices down, while rising tensions in the Middle East actually caused gas prices to rise. And with that, electricity prices also rose. This led to significant price fluctuations throughout the day. Batteries were able to respond effectively to this by storing excess solar energy during hours when prices were low and feeding it back into the grid when prices were high, particularly in the afternoon.
This first month of the year, with significant solar power generation, provides a clear picture of what we can expect in the coming period. If tensions in the Middle East persist and gas prices continue to rise, price differentials are expected to widen further within a single day.
1 | Solar Energy
Do you generate solar energy? Then this update is for you. We’ll show you how energy prices in March affected the earnings from solar installations.

Solar power generation rose sharply in March, more than doubling compared to February. Regular sunny weather with little cloud cover led to a plentiful supply and drove electricity prices down. At the same time, rising tensions in the Middle East led to higher gas prices. When gas-fired power plants took over from solar power, this resulted in significant price fluctuations throughout the day.
1.1 | Volume and value of solar energy
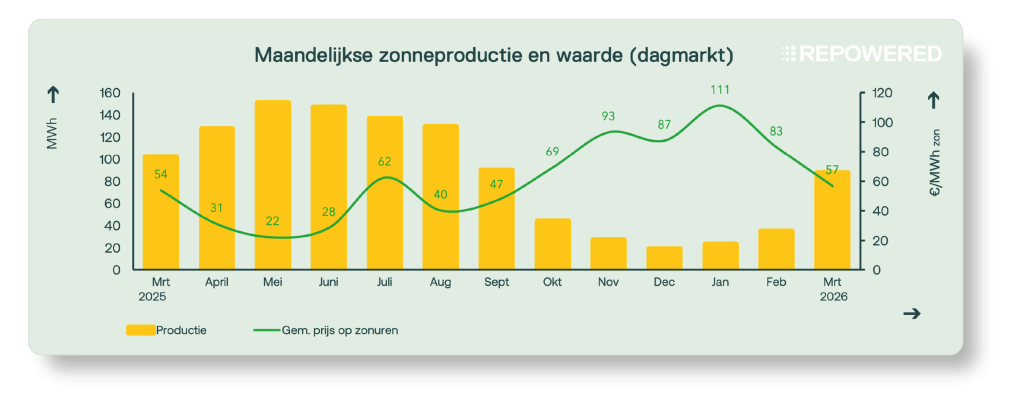
The “duck curve” was clearly visible in the price charts this month. Solar installations achieved an average yield of approximately €57/MWh, about 60% of the average day-ahead market price (€98/MWh).
This price difference can usually be explained by the timing of production. In the middle of the day, a large supply of solar energy keeps prices low. Outside of these hours, however, prices rise rapidly because gas-fired power plants are needed to meet demand. As a result, the average electricity price throughout the day remains relatively high.
1.2 | Negative prices on the spot market
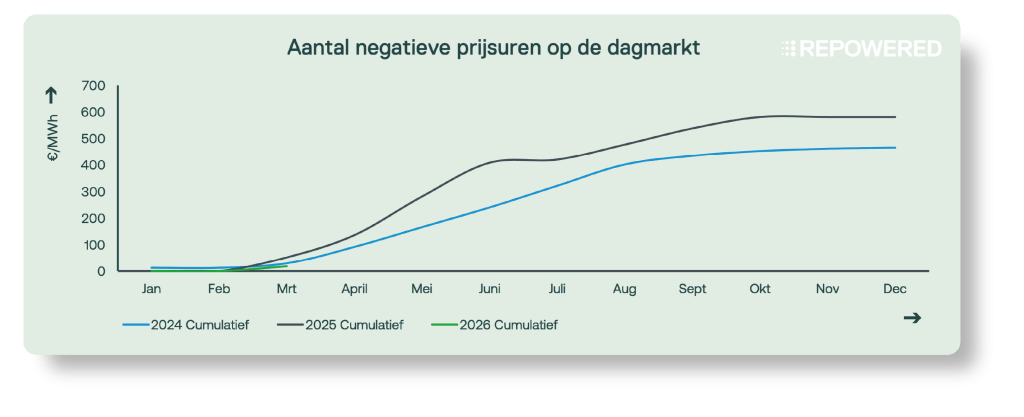
This month, there were 18 hours of negative prices on the day-ahead market. On more than half of those days, prices even dropped to €0/MWh or lower around noon due to strong solar generation. There were also periods of low prices at night due to strong winds. However, there were no consecutive 6-hour blocks of negative prices.
This marks the start of a trend we can expect to see more often in the coming months. Negative prices occur when producers continue to supply electricity while demand remains limited. This is often due to the fact that power plants cannot be controlled, or that operational support schemes such as SDE++ encourage production.
2 | Batteries
Do you have a battery? Then this update is for you. We’ll show you how energy prices in March affected the earning potential of batteries.

March was an extreme month. There were both significant price fluctuations in the day-ahead market and several periods of major imbalance. During periods when renewable energy sources were not generating power, this was largely offset by gas-fired power plants, which also supply a significant portion of the balancing energy. As a result, high gas prices had a major impact on both day-ahead and imbalance prices.
In addition, another record was set: 41% of the quarter-hourly periods ended in state 2. Batteries were able to respond effectively to this volatility, underscoring their important role in providing sustainable flexibility to the energy system.
2.1 | Day Market: Price Distribution
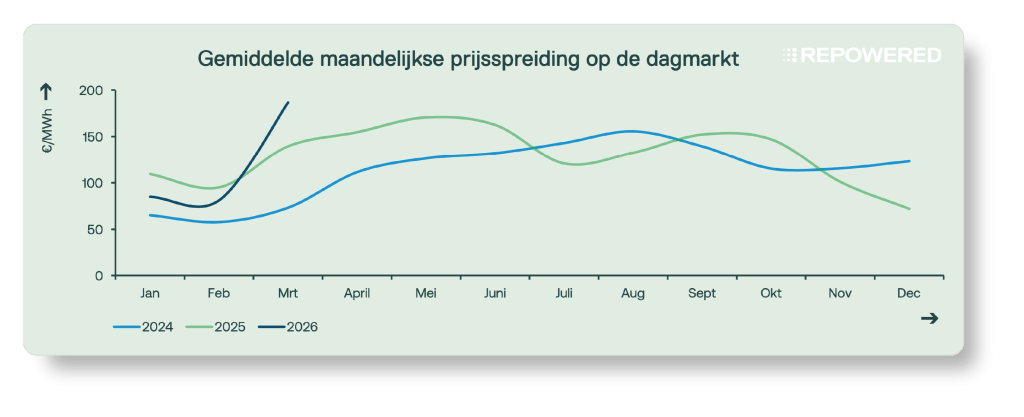
There were plenty of opportunities this month to capitalize on price differentials in the day-ahead market. The main driver was the sharp contrast between low-cost hours driven by solar generation and the extremely expensive mornings and evenings, caused by high gas prices and startup costs. With gas prices rising by more than 70% compared to last month, the impact of this was clearly visible in the electricity market.
The average daily price spread was €187/MWh. Batteries were able to effectively capitalize on this by storing surplus solar energy around noon and feeding it back into the grid during the expensive evening hours. Daily price differences above €200/MWh are exceptional, but occurred with striking frequency this month: on about 15 days, prices dropped to zero around noon and then rose to over €200/MWh. By comparison, this happened on only three days in March 2025.
2.2 | Imbalance Market: Price Dispersion
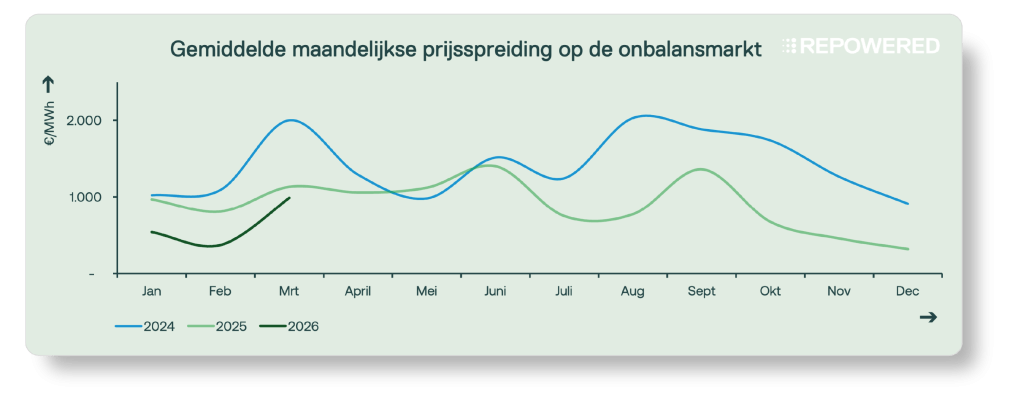
March 2026 was similar to March 2025: the trend of falling imbalance prices and lower volatility seen in recent months did not continue. High gas prices led to costly ramp-ups, while the increase in solar energy and the difficulty in predicting wind generation increased variability. This combination led to high imbalance prices at several points.
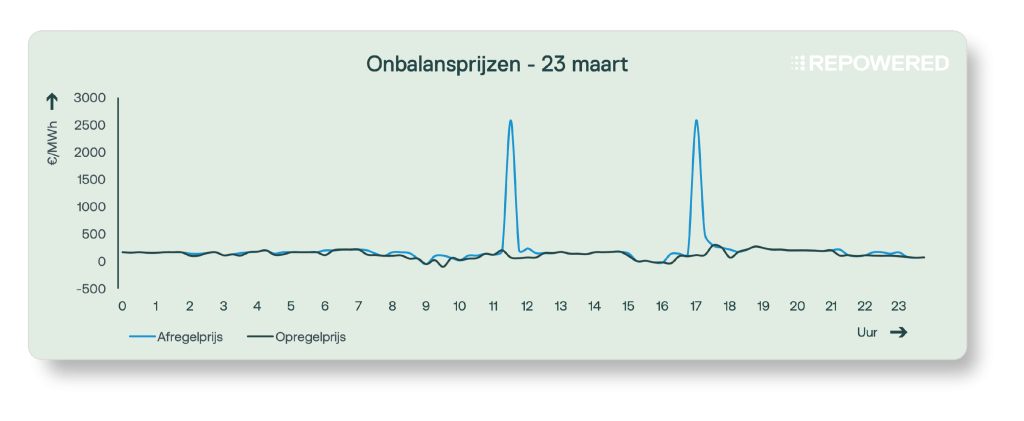
Whenever extra energy was needed to cover shortfalls in the system, imbalance prices rose sharply. On about 10 days, prices exceeded €2,500/MWh. On the other hand, prices fell several times to around –€600/MWh. This combination of high peaks and deep troughs resulted in significantly higher volatility.
2.3 | Imbalance Market: Control State 2
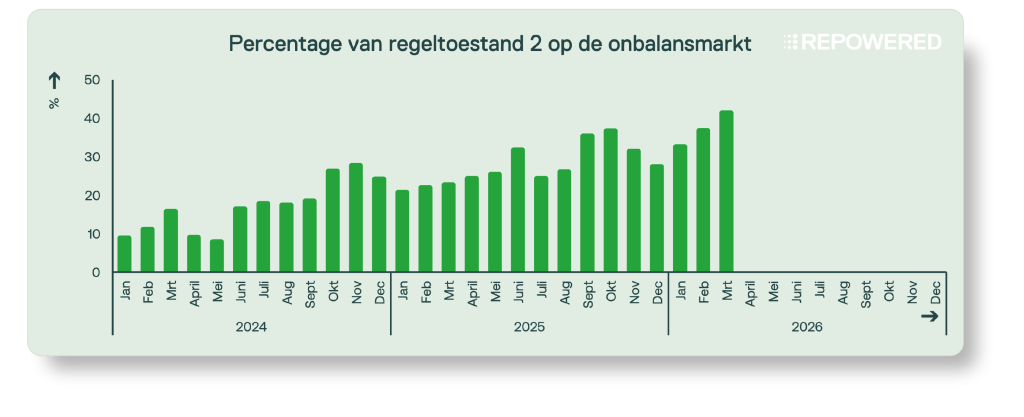
The share of control state 2 reached a new record this month: 41% of the quarter-hours ended in control state 2. On several occasions, extreme prices coincided with control state 2, which can pose a significant risk to market participants with high levels of imbalance. A clear example was March 23, when the system entered control state 2 twice during periods of very high imbalance prices of €2,500/MWh.
Feeling lost in technical jargon?
Don't worry! We've got a handy glossary ready for you👇