Market Update | May 2026
Every month, we share the most important developments in the energy market. We explain how energy prices are determined, highlight trends over several months and years, and provide insight into how the market affects your energy bill.
The Energy Market in May
Last month saw high solar energy production and relatively low wind energy production. This led to low electricity prices during the afternoon hours, particularly in the second half of the month, with prices regularly dropping toward €0/MWh. Solar installations generated an average of €41/MWh, slightly higher than in April.
In addition, the market offered plenty of opportunities for batteries and flexible energy consumers. Significant imbalances between supply and demand led to substantial price fluctuations in the day-ahead market, with price differences regularly exceeding €200/MWh within a matter of hours. Prices were also volatile in the balancing market. These dynamics created attractive opportunities to make optimal use of flexibility.
1 | Solar Energy
Do you generate solar energy? Then this update is for you. We’ll show you how this month’s energy prices have affected the earnings from solar installations.

May was a warm and sunny month. Solar power generation remained high, especially during the afternoon hours. However, electricity prices fell less sharply during these hours than in April and often hovered around €0/MWh. This can be partly explained by higher electricity demand. The warm weather led to an increased need for cooling, which drove up electricity consumption.
1.1 | Volume and value of solar energy
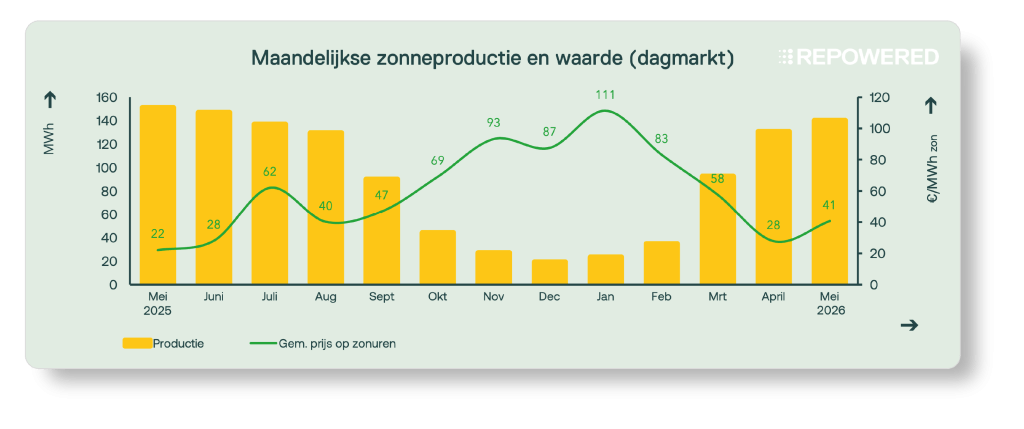
In May, solar energy was worth an average of €41/MWh, approximately 44% of the average price on the day-ahead market (€94/MWh). Due to the simultaneous sharp increase in supply during sunny midday hours and relatively low demand for electricity in the middle of the day, solar energy is worth less on average.
1.2 | Negative prices
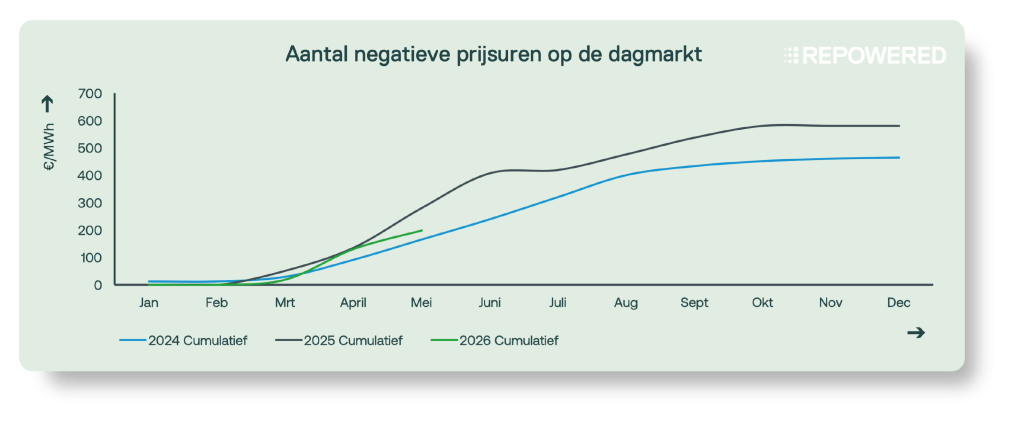
In May, there were 68 hours with negative electricity prices, significantly fewer than in April. Of these hours, 35 were part of blocks of six consecutive hours with negative prices. For solar parks with an SDE++ decision issued in 2016 or later, no subsidy is paid for these hours.
Although prices were less negative compared to April, they still regularly hovered around €0/MWh in May. We are seeing this trend more and more often. A major reason is that an increasing number of solar installations can actively participate in the day-ahead market using limit orders. Under this system, electricity is sold only when the market price exceeds a preset threshold. If the price falls below that threshold, production is curtailed and no energy is offered to the market.
This trend is expected to continue as more installations become flexible and controllable. Policy changes may also contribute to this. For example, the phase-out of the net metering scheme for small consumers in 2027 could result in less solar energy being fed back into the grid during hours when prices are low, which may lead to negative prices occurring less frequently.
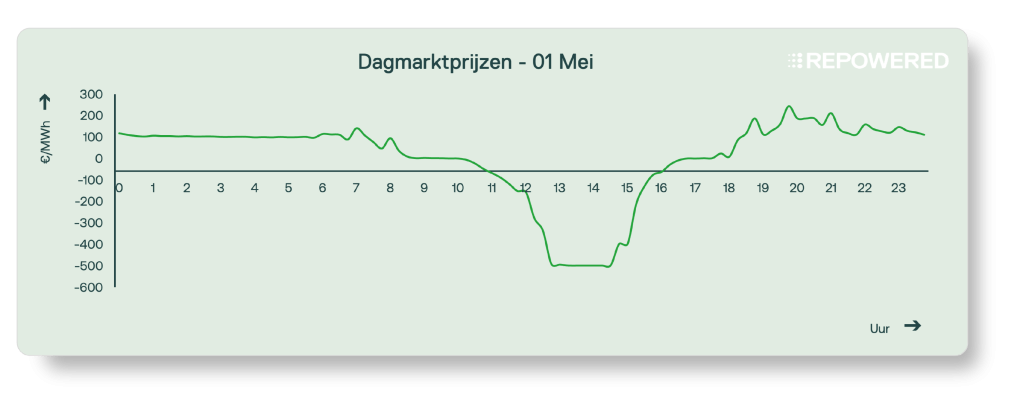
On May 1, the day-ahead market reached a low of -€500/MWh. This means that electricity was traded at the lowest possible price. The combination of a very sunny day and low electricity demand due to a public holiday in large parts of Europe resulted in an exceptionally large surplus of electricity. As a result, prices fell to the market minimum.
In response to this event, the floor price on the day-ahead market has been lowered to -€600/MWh. If such situations occur more frequently, this limit may be lowered further in the future. These extremes highlight the growing challenge posed by a large supply of solar energy during the afternoon hours, while there is insufficient demand and flexibility available to absorb this surplus.
2 | Batteries
Do you have a battery? Then this update is for you. We’ll show you how this month’s energy prices have affected the earning potential of batteries.

May was a good month for batteries. Both the day-ahead market and the imbalance market saw significant price differentials that presented opportunities for flexibility. On the day-ahead market, the average price spread was approximately €200/MWh. This was mainly driven by low prices during sunny afternoon hours and higher prices in the evening, particularly in the second half of the month.
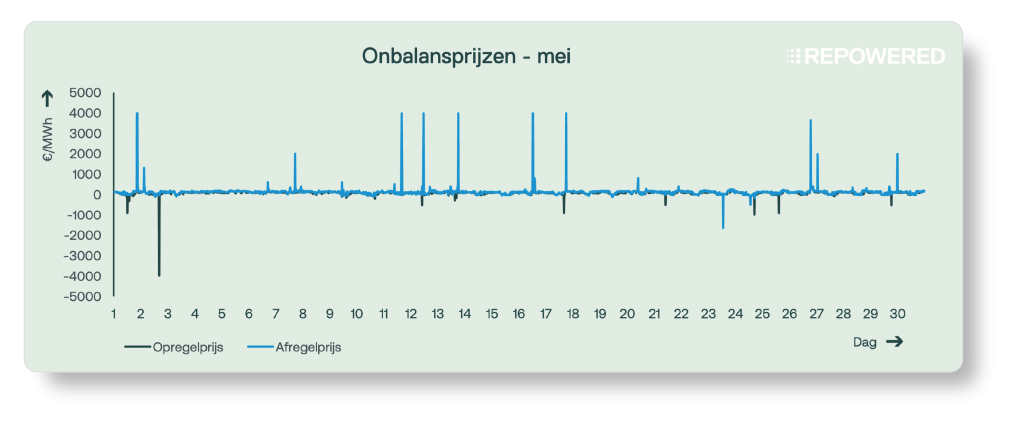
The imbalance market also experienced high volatility. At several points, imbalance prices rose to €3,500–4,000/MWh. Outside of these peaks, however, the earning potential in the imbalance market was limited. As in previous months, control state 2 was common and applied in approximately 40% of all quarter-hourly periods.
2.1 | Day Market: Price Distribution
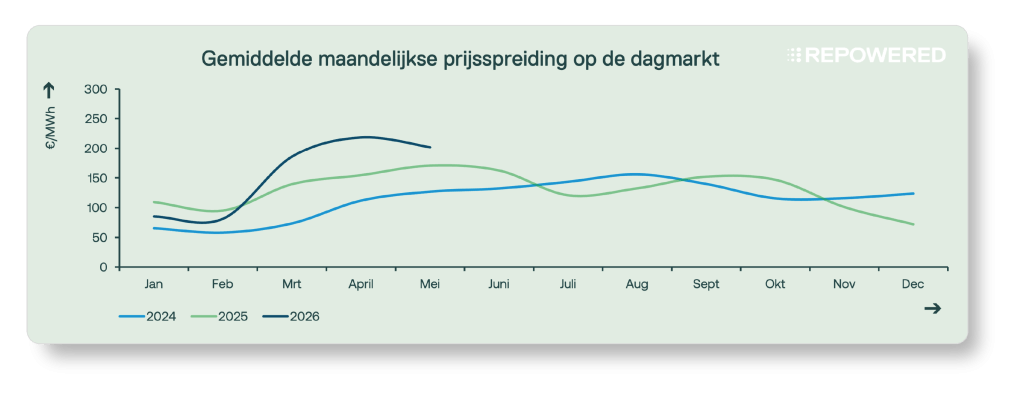
Opportunities for arbitrage trading (buying at a low price and selling at a high price) were once again very good in May. The wide price spread was mainly caused by the contrast between low prices during sunny afternoon hours and significantly higher prices in the morning and evening. Batteries can take advantage of these price differences by storing electricity when there is a surplus of solar energy and feeding it back into the grid during the hours with the highest value. The average daily price spread was €202/MWh, comparable to last month.
Price fluctuations were particularly pronounced during the last ten days of May. Due to the warm and sunny weather, afternoon prices regularly dropped toward €0/MWh, while evening prices rose above €150/MWh and reached even higher levels on some days. A major factor behind this was the increased demand for electricity for cooling. At temperatures around 25°C, electricity demand increases, while solar energy production actually decreases toward the end of the day. As a result, other energy sources, such as gas-fired power plants, must ramp up to meet demand, leading to higher prices during the evening hours.
2.2 | Imbalance Market: Price Dispersion
May was a very strong month for batteries in the imbalance market. The large price fluctuations were primarily driven by ten instances in which the imbalance price rose to €3,500/MWh. During most of these events, control state 2 was not in effect, allowing batteries to actively contribute to restoring system balance and receive compensation for doing so.
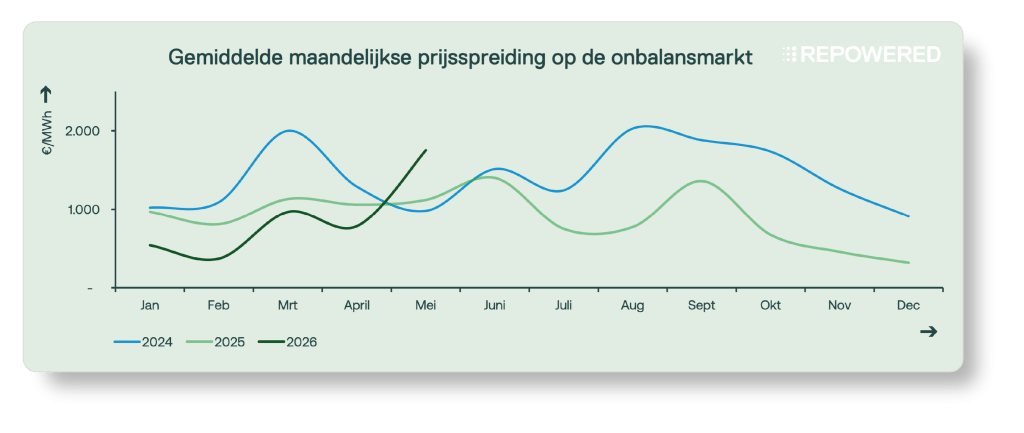
Apart from these extreme price spikes, the month saw a more typical market pattern. Excluding those ten extreme instances, the average daily price difference would have been approximately €1,100/MWh, rather than €1,700/MWh.
The highest imbalance prices occurred mainly during periods of shortage in the electricity system, when demand exceeded available supply. This occurred primarily in the evening hours, when solar power generation declines, but also occurred during sunny hours.
2.3 | Imbalance Market: Control State 2
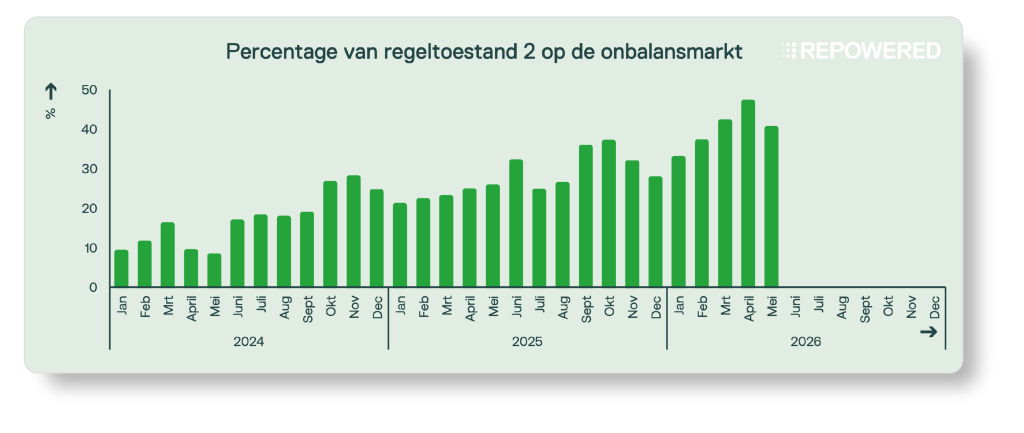
The proportion of quarters with control status 2 was 40% in May, compared to 25% in May 2025 and just 8% in May 2024. This sharp increase shows that the electricity system is increasingly facing situations in which market participants collectively deviate from their schedules in the same direction.
At the same time, extreme imbalance prices occurred during both shortages and surpluses in the system. On May 2, market participants with a surplus faced an imbalance price of €4,000/MWh. On May 12, a similar situation arose for market participants with a shortage.
Would you like to receive the market update by email?
We'll send it to you every month.
Glossary
Feeling lost in technical jargon? We're here to help.