Market Update | February 2026
Every month, we share the most important developments in the energy market. We explain how energy prices are determined, highlight trends over several months and years, and provide insight into how the market affects your energy bill.
February: From wintry days to sunny opportunities
February brought milder temperatures and the first signs of longer, brighter days after a cold January. The month had a bit of everything: freezing days with snow and sunny days with low electricity prices.
Solar power generation increased compared to January, although it remained limited at the beginning of the month. Toward the end of February, generation rose and price differences in the day-ahead market widened. Electricity became cheaper in the afternoon and more expensive in the evening. This had a positive effect on the earnings of flexible installations, such as batteries.
Earning potential in the imbalance market remained low. This was due to low imbalance prices and a large number of quarters with control state 2.
1 | Solar Energy
Do you generate solar energy? Then this update is for you. We’ll show you how energy prices in February affected the earnings from solar installations.

February was dark and gray, with occasional snow and a few sunny days. As a result, solar power generation remained low, and gas-fired power plants had to step in frequently to meet demand. This caused the average electricity price during periods of solar generation to be relatively high: €83/MWh. When the sun did shine, prices fell.
1.1 | Volume and value of solar energy
In February, solar energy production remained limited, as is typical for this time of year. During the winter months, approximately one-quarter of the energy is generated compared to the summer months. Compared to the previous three months, solar energy production rose slightly in February.
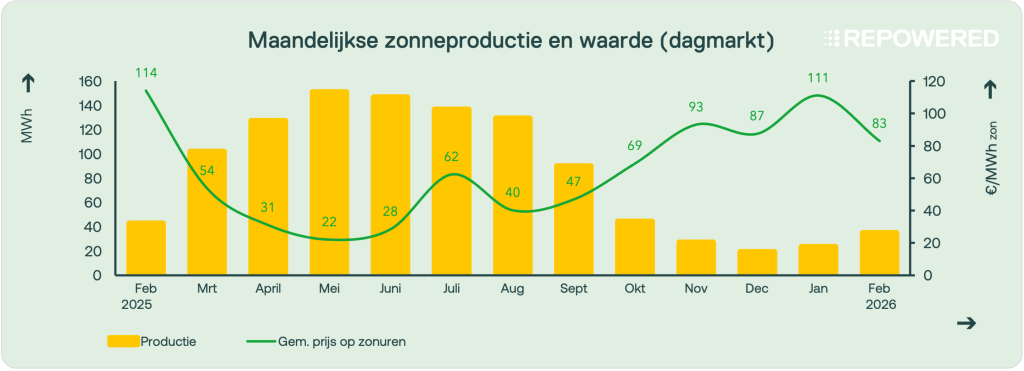
During hours when solar power was generated, the average price on the day-ahead market was around €83/MWh, while the overall average price for the month was €93/MWh. This is relatively high compared to the rest of the year; in May 2025, for example, the average price fell to €22/MWh.
The main difference compared to January was particularly evident in the second half of February. Mild and sunny weather led to an increase in solar power generation. During sunny periods, fewer other sources of power, such as gas-fired power plants, were needed to meettotal electricity demand. This put downward pressure on electricity prices, resulting in lower revenues for solar power producers.
1.2 | Negative prices on the spot market
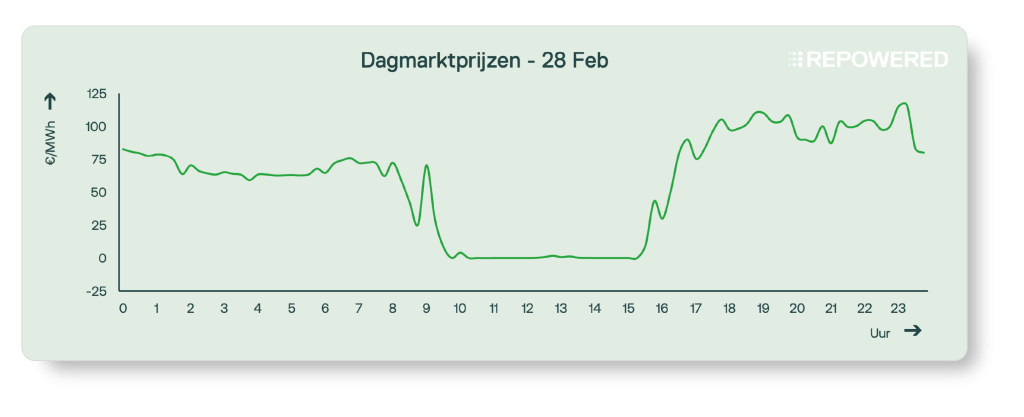
Toward the end of the month, for example on February 28, it was clear that spot market prices were falling sharply due to increased solar power generation. From 9:45 a.m. to 3:30 p.m., the electricity price hovered around €0/MWh.
More and more solar farms are temporarily reducing their output (curtailment) when prices drop too low. During these hours, revenue is virtually zero, and no SDE++ subsidy is paid out when prices are negative.
- For solar installations receiving an SDE+ subsidy starting in 2023, this applies to every hour with a negative price.
- For solar installations receiving an SDE++ subsidy from 2016 through 2022, no subsidy will be paid if the energy price is negative for six consecutive hours.
2 | Batteries
Do you have a battery? Then this update is for you. We’ll show you how energy prices in February affected the earning potential of batteries.
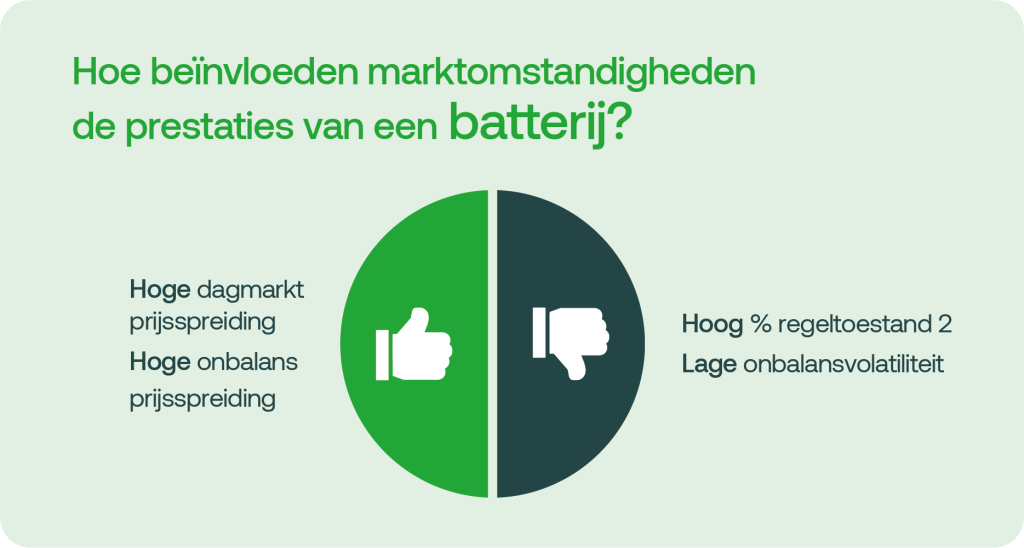
Overall, potential earnings were similar to those in January, with one notable exception: the last week of February. Increased sunshine led to wider price fluctuations throughout the day, which batteries were able to capitalize on effectively.
Earning potential remained limited in the imbalance market. Prices were stable, and a large number of quarter-hours fell under control condition 2, leaving few opportunities to generate additional revenue.
2.1 | Day Market: Price Distribution
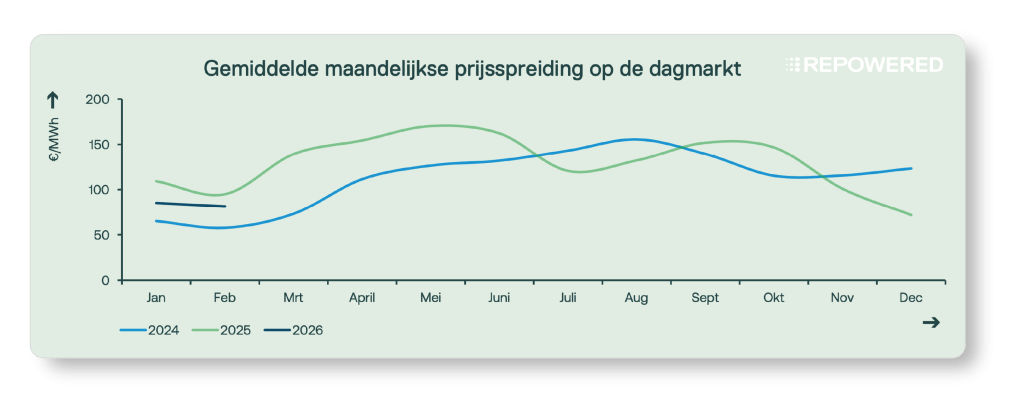
In February, the potential returns from a battery in the intraday market (buying low, selling high) were largely similar to those in January. The average monthly price spread was also roughly the same, as shown in the graph. However, this average does not accurately reflect the changes at the end of the month; in the final week, opportunities for batteries increased significantly.
Sunny weather led to an increase in solar power generation, resulting in low prices in the middle of the day. In the evening, gas-fired power plants had to ramp up production, causing prices to rise. This resulted in significant price fluctuations throughout the day. Batteries can effectively respond to this: they store solar energy when prices are low and feed it back into the grid when prices rise, thereby maximizing their benefit from price fluctuations.
2.2 | Imbalance Market: Price Dispersion
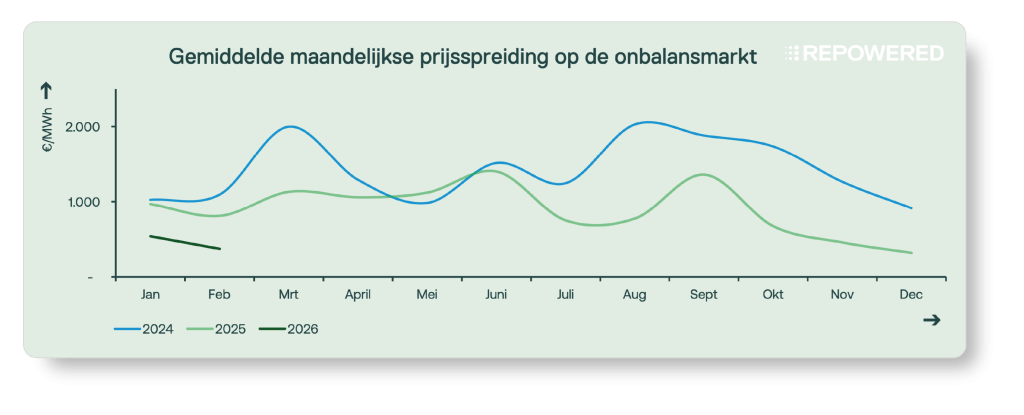
In February, revenue opportunities for batteries in the imbalance market were once again limited. Imbalance prices were low, and the revenue batteries could generate fell to about half of last year’s level.
One key reason is that more and more European countries are joining the aFRR energy platform (PICASSO), and the number of market participants is growing. This makes balancing the electricity system more efficient: the Dutch balancing market now competes with bids from other countries . The system is becoming cheaper and more efficient. Price spikes still occur, but much less frequently than before.
2.3 | Imbalance Market: Control State 2
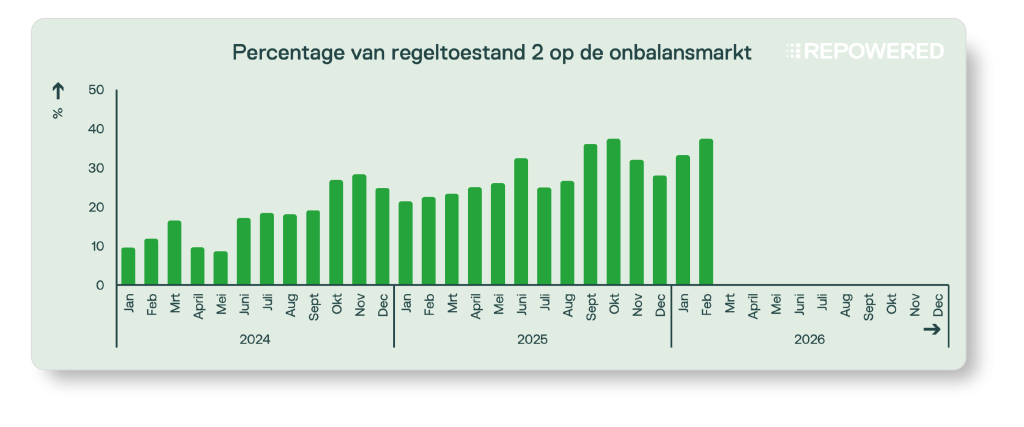
In February, the proportion of quarters in control state 2 reached a new record: 37% of quarters ended in control state 2. On some days, more than half of the quarters ended in control state 2.
One possible explanation is that, starting February 3, TenneT will calculate the balance delta every 12 seconds instead of every minute. This gives the market faster insight into changes in the system balance, allowing market participants to respond sooner. This can lead to overshooting: too many participants respond too quickly with too much power, causing the system to swing from a deficit to a surplus (or vice versa).
Feeling lost in technical jargon?
Don't worry! We've got a handy glossary ready for you👇