Market Update | June 2026
Every month, we share the most important developments in the energy market. We explain how energy prices are determined, highlight trends over several months and years, and provide insight into how the market affects your energy bill.
The Energy Market in June
June was a strong month for solar energy. No less than one-third of the national electricity supply was generated by solar panels. In addition, the heat wave in the second half of the month led to higher electricity prices, from which solar energy producers also benefited. Due to increased demand for electricity, particularly for cooling, the market value of solar energy was higher than in previous months. On average, it stood at €69/MWh, or 63% of the average daily market price.
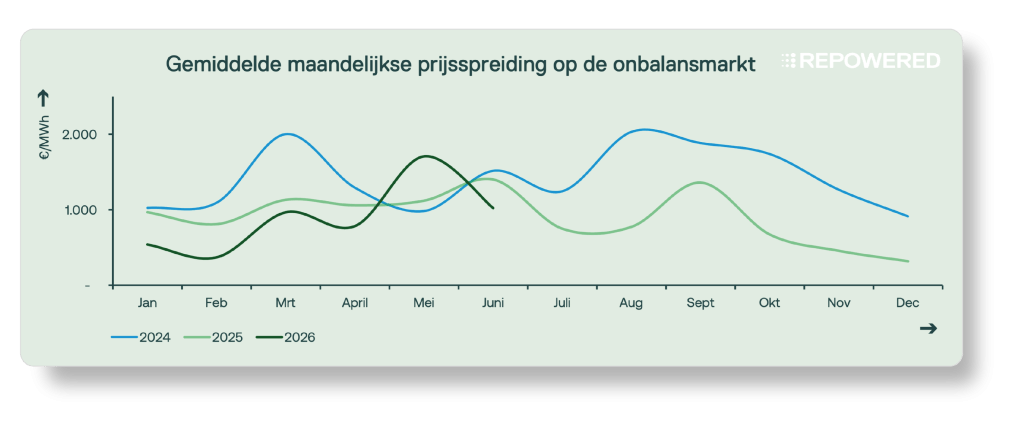
June was also a strong month for batteries. Price differentials on the day-ahead market rose further to €256/MWh, the highest level this year. In addition, imbalance prices were highly volatile, with several peaks above €2,000/MWh. At the same time, control state 2 remained notably high, accounting for 41% of all quarter-hours.
1 | Solar Energy
Do you generate solar energy? Then this update is for you. We’ll show you how this month’s energy prices have affected the earnings from solar installations.

June was a very sunny and warm month. Solar power generation remained high throughout the month and accounted for about one-third of the national electricity supply. In the second half of the month, not only the Netherlands but also much of Europe experienced a heat wave. Although this heat wave led to higher solar energy production, it also put additional strain on the power grid due to the sharp increase in electricity demand, particularly for cooling. As a result, electricity prices were higher on average than in previous months, and the market value of solar energy stood at approximately €69/MWh.
1.1 | Volume and value of solar energy
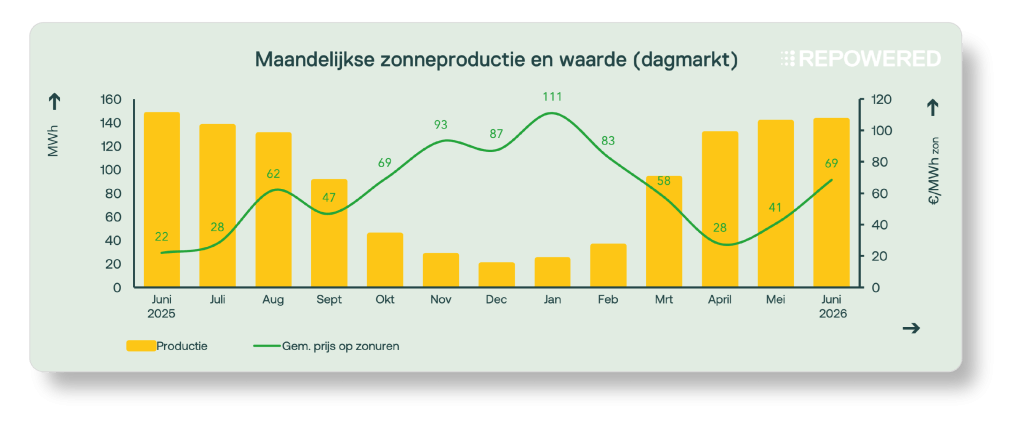
In June, solar power plants earned an average of €69/MWh, equivalent to 63% of the average day-ahead market price (€110/MWh). Solar power producers thus achieved higher revenues on the day-ahead market than in previous months. This was primarily due to increased electricity demand for cooling.
1.2 | Negative prices
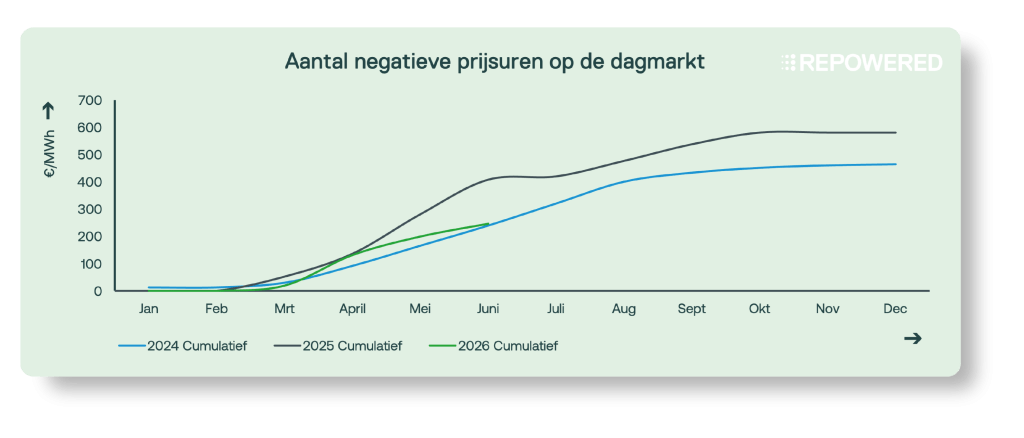
In June, there were (only) 47 hours with negative electricity prices, fewer than the 68 hours in May. Of these 47 hours, 30 occurred in consecutive blocks of six hours or longer. During such periods, some solar installations do not receive an SDE subsidy. The graph above shows that the number of hours with negative prices so far in 2026 is lower than in 2025.
The heat wave had a clear impact on intraday market prices. The additional demand for electricity for cooling absorbed a large portion of the available solar power generation, causing prices to remain mostly around zero. As a result, the deep negative prices seen in previous months were largely absent.
2 | Batteries
Do you have a battery? Then this update is for you. We’ll show you how this month’s energy prices have affected the earning potential of batteries.

June was a good month for batteries, partly thanks to the heat wave in the second half of the month. Price differentials on the day-ahead market reached their highest level this year, with an average spread of €256/MWh. Imbalance prices were also highly volatile, especially during the evening hours. At several points, they rose above €2,000/MWh.
The heat wave put pressure on the power grid, thereby increasing the revenue potential for batteries in both the day-ahead market and the imbalance market. In addition, control state 2 occurred in 41% of all quarter-hours.
2.1 | Day Market: Price Distribution
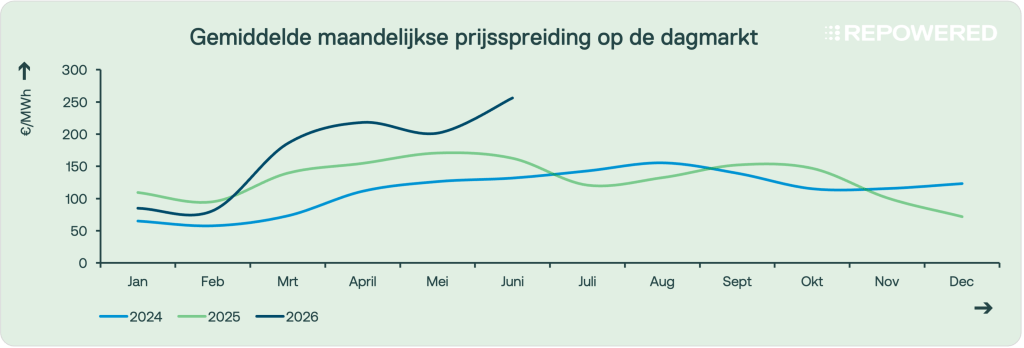
Arbitrage opportunities in the day-ahead market (buying when prices are low, selling when prices are high) were particularly significant in June. The average daily price spread was €256/MWh, the highest level this year. This was mainly due to the heat wave in the second half of the month. During the first two weeks, a combination of high wind generation and lower solar power generation meant that significant price differences did not materialize.
Starting around June 18, arbitrage opportunities increased significantly. On several days, batteries were able to capitalize on price spreads of over €300/MWh. High solar power generation pushed daytime prices down, but not to the negative levels seen in previous months. In the evening, however, prices rose rapidly as solar power generation declined while electricity demand remained high.
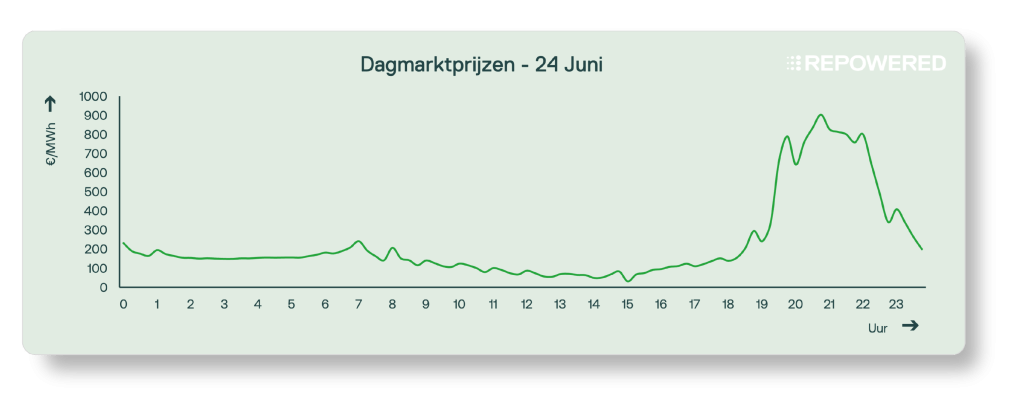
The record-breaking heat in the Netherlands during week 26 led to exceptionally high prices on the day-ahead market. On June 24, the price of electricity rose to €902/MWh, an exceptionally high level not seen in the Netherlands for years.
Several factors contributed to these high evening prices. The warm weather led to increased demand for electricity for cooling. At the same time, wind power generation was limited, and conventional power plants were operating less efficiently due to the high temperatures. Furthermore, as the sun set and solar power generation declined rapidly, more expensive power plants had to be brought online to meet the high demand for electricity.
2.2 | Imbalance Market: Price Dispersion
The imbalance market remained volatile in June as well, allowing batteries to respond effectively to price fluctuations. Although the imbalance price rose to €4,000/MWh less frequently than in May, high prices were still reached regularly this month, particularly during the evening hours.
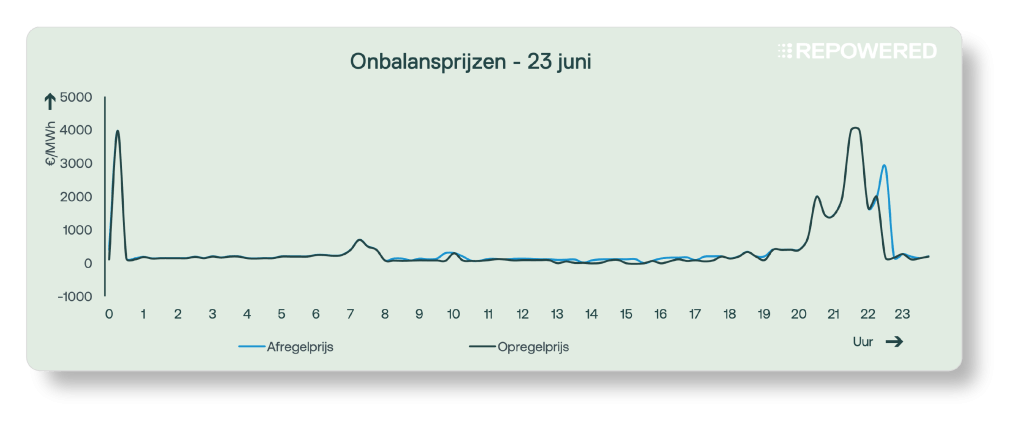
On June 23, imbalance prices rose above €2,000/MWh for two hours in the evening.
At that time, the power grid was already under strain due to the heat wave, making it difficult for supply to meet the high demand for electricity. In such a situation, any disruption to the system balance can have a major impact, and that was indeed the case here. Multiple simultaneous disruptions in the European power system led to an increased need for balancing, forcing TenneT to activate approximately 400 MW of additional reserves at very high costs.
2.3 | Imbalance Market: Control State 2
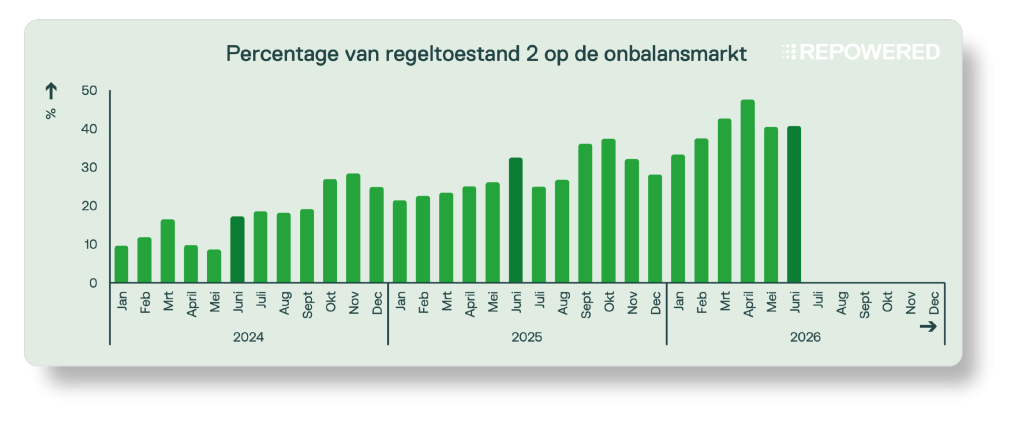
The share of control state 2 was 41% in June, comparable to the previous month. TenneT is investigating how this situation can be mitigated, as control state 2 is associated with rapid fluctuations between supply and demand in the electricity system. These fluctuations make it more difficult to resolve imbalances and maintain grid stability.
Possible explanations include the behavior of market participants, seasonal effects, and differences between market outcomes and the physical state of the electricity system. At this time, however, it is not yet possible to determine to what extent these factors are actually the cause.
3 | New Topic! Onshore Wind
Wind energy currently accounts for about 25% of annual electricity production in the Netherlands. About half of that comes from offshore wind farms and the other half from onshore wind farms. With the government’s goal of achieving a total of 40 GW of offshore wind capacity by 2040, wind energy will play an increasingly important role in the Dutch electricity supply. That is why, starting this month, we are adding a new section on wind energy to our market update.
Are you a wind farm owner or interested in developments in wind energy? Then this update is for you. We’ll show you how this month’s energy prices have affected the revenue potential of onshore wind energy, without applying a trading strategy.
To help you properly interpret this new section, we have listed a few important points to keep in mind below:
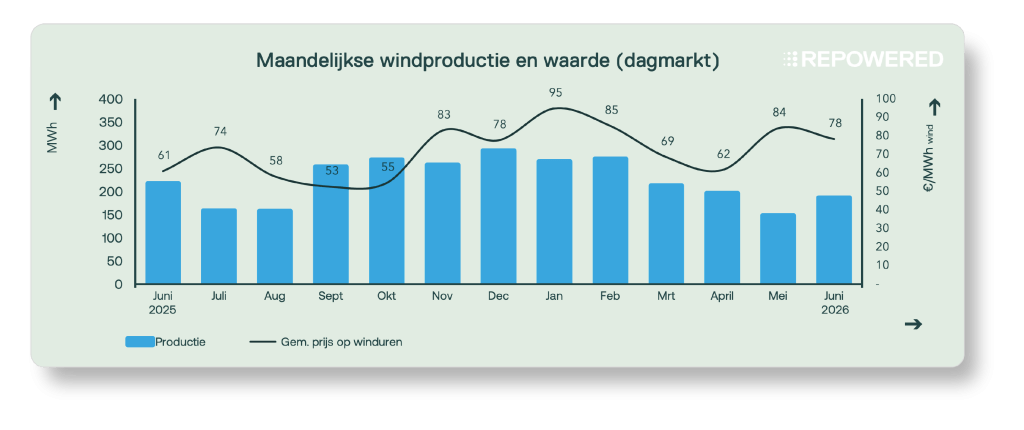
- Production peaks in the fall and winter. During this period, wind speeds are higher on average. At the same time, electricity prices are often higher, which generally leads to an increase in wind energy revenues. This is clearly visible in the graph for the months of September through February.
- The market value of wind energy is close to the average daily market price. Unlike solar energy, wind power generation is more evenly distributed throughout the day and throughout the year. In addition, a relatively large amount of wind energy is generated during hours when electricity prices are higher, such as at night and during the fall and winter months.
- Production is highly location-dependent. The amount of wind energy generated depends on local wind conditions. For example, it is windier and the winds blow more frequently along the coast than inland, while open areas are generally more favorable than urban environments. As a result, both the production and the market value of wind energy can vary significantly from one location to another.
Would you like to receive the market update by email?
We'll send it to you every month.
Glossary
Feeling lost in technical jargon? We're here to help.