
Market Update | July 2026
Every month, we share the most important developments in the energy market. We explain how energy prices are determined, highlight trends over several months and years, and provide insight into how the market affects your energy bill.
The Energy Market in July
July was a relatively quiet month on the energy market. Thanks to the sunny weather, a lot of solar energy was generated. The average price of solar energy fell slightly compared to June, but at €59/MWh, it remained relatively high. The number of hours with negative prices also continued to decline. In fact, by the end of July, this number was lower than it had been at the same time in 2025 and 2024.
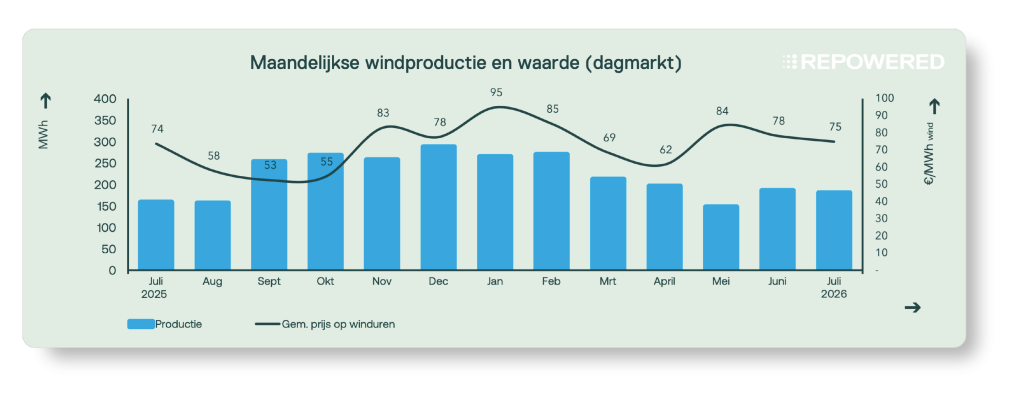
Onshore wind power generation was limited, as is typical in the summer. The average price of wind power was €75/MWh.
July was also a relatively quiet month for batteries. Price differences on the day-ahead market narrowed slightly to an average of €182/MWh. On the imbalance market, there were few extreme prices, and control state 2 remained high at 43% of the quarters.
1 | Solar Energy
Do you generate solar energy? Then this update is for you. We’ll show you how this month’s energy prices have affected the earnings from solar installations.
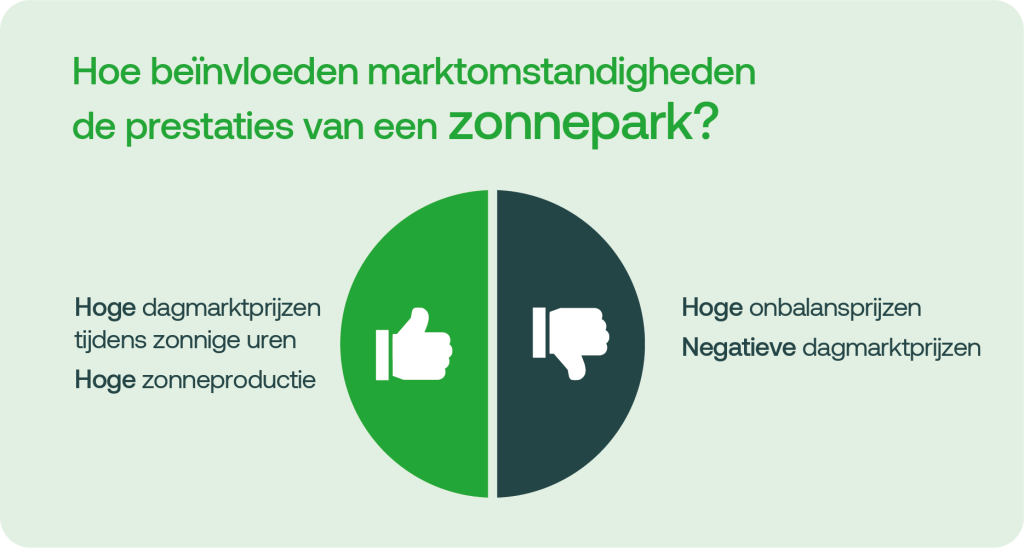
July was a very sunny month, with high solar energy production. As in June, the average price of solar energy remained relatively high. The number of hours with negative prices was also limited. As a result, 2026 has had fewer hours with negative prices so far than in the same period of 2024 and 2025.
1.1 | Volume and value of solar energy
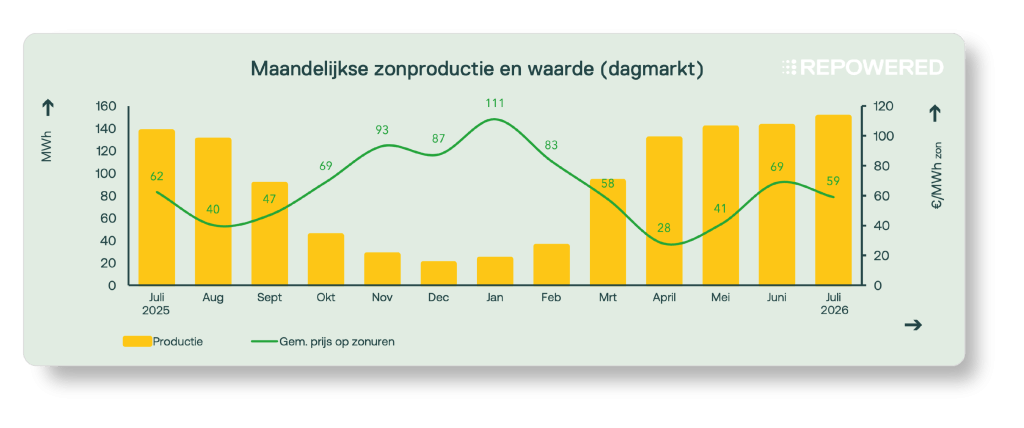
The average price of solar energy on the day-ahead market was €59/MWh, or 56% of the average day-ahead market price of €106/MWh. As in June, this price was significantly higher than in April and May. This is mainly due to higher prices in the morning and late afternoon, which solar energy producers can take advantage of.
1.2 | Negative prices
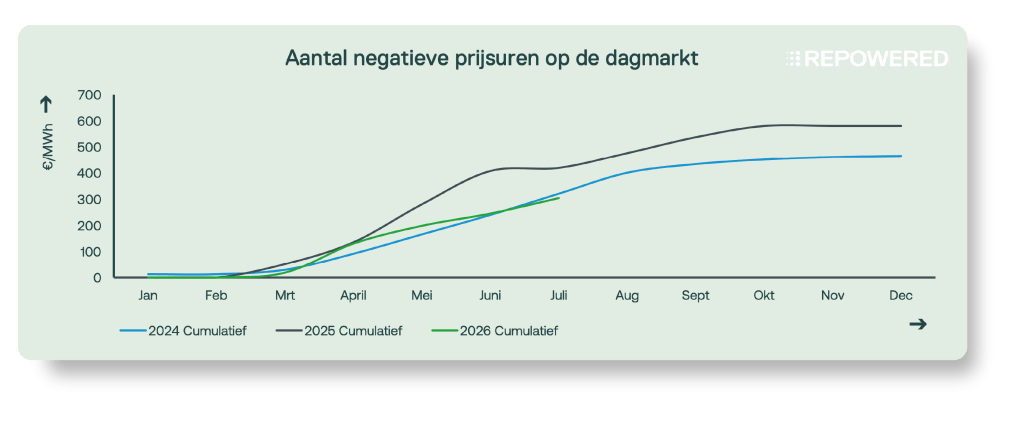
In July, there were 59 hours with negative prices. As a result, through July 2026, there have been fewer hours with negative prices than during the same period in 2025 and 2024. It is notable that prices are now only dropping slightly below €0/MWh. This trend has also been evident in recent months.
One possible explanation is that an increasing number of market participants are choosing not to sell electricity on the day-ahead market when prices are negative. Instead, they curtail generation or trade it on another market, such as the intraday market.
Of the 59 hours with negative prices, 28 were part of blocks of six or more consecutive hours. During such long periods of negative prices, some solar farms lose their eligibility for the SDE subsidy.
2 | Batteries
Do you have a battery? Then this update is for you. We’ll show you how this month’s energy prices have affected the earning potential of batteries.
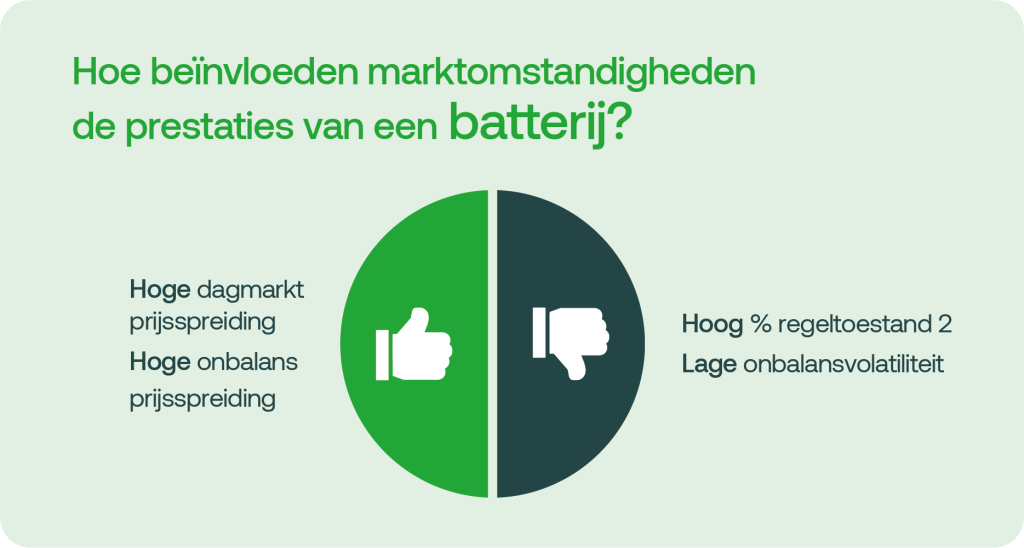
July was a relatively quiet month for batteries. Price dispersion in the day-ahead market decreased, and volatility also remained limited in the imbalance market.
2.1 | Day Market: Price Distribution
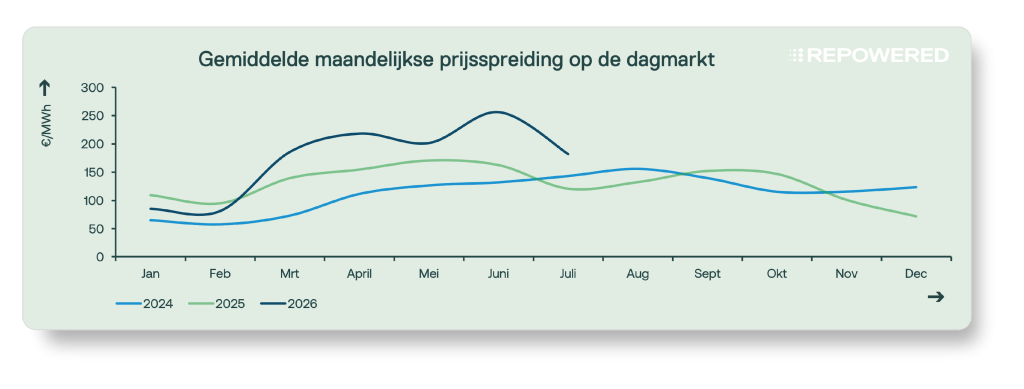
Arbitrage opportunities in the day-ahead market (loading when prices are low and unloading when prices are high) were more limited than in June. Nevertheless, the profit potential remained attractive, with an average daily price difference of approximately €182/MWh. Around noon, prices regularly hovered around €0/MWh, while in the evening they rose to about €200/MWh.
Running a second cycle on the same day was often not cost-effective. Prices remained relatively high throughout the night and did not drop until later in the morning, meaning that charging at night and discharging during the morning peak yielded little to no additional revenue.
2.2 | Imbalance Market: Price Dispersion
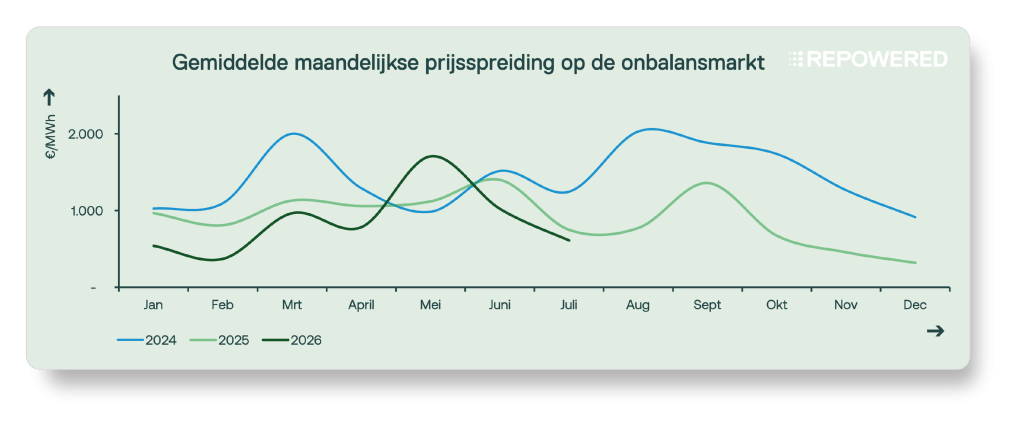
The balancing market showed little volatility. There were no extreme weather conditions, such as a heat wave or periods of high winds, so the power system remained relatively stable throughout the month. As a result, there were few upward or downward price spikes. The maximum daily price difference was approximately €600/MWh, half the level seen in June.
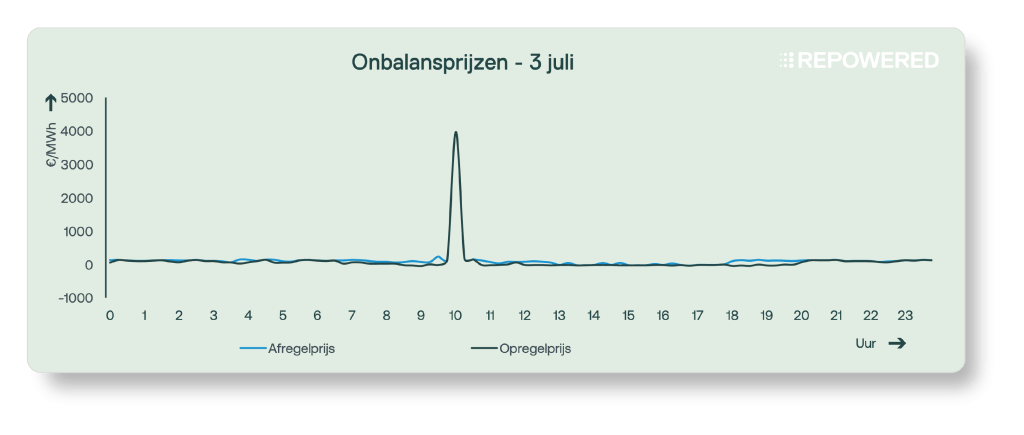
Despite a relatively quiet month, there was a notable price spike on the imbalance market at 10:00 a.m. on July 3. Approximately 500 MW of balancing capacity had to be activated, causing the imbalance price to rise to €4,000/MWh.
The exact cause of this sudden need for balancing capacity is unknown. It is noteworthy that the international platforms PICASSO and IGCC did not contribute to resolving the imbalance. This suggests that the imbalance arose entirely within the Dutch electricity system and had to be resolved at the national level. This is what allowed the imbalance price to rise so high.
2.3 | Imbalance Market: Control State 2
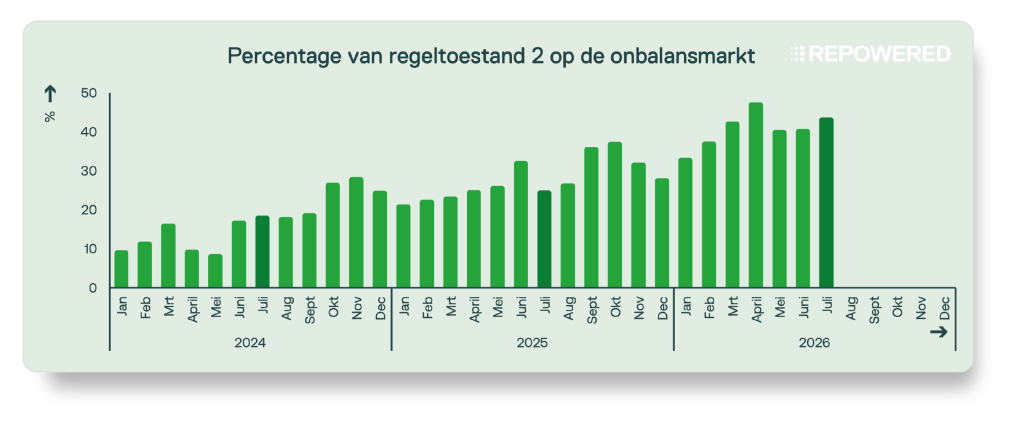
In addition to the low volatility, the proportion of quarters in control state 2 also remained high. In July, 43% of all quarters ended in this control state.
3 | Onshore Wind
Do you generate onshore wind energy? If so, this update is for you. We’ll show you how energy prices this month have affected the earnings of onshore wind farms.
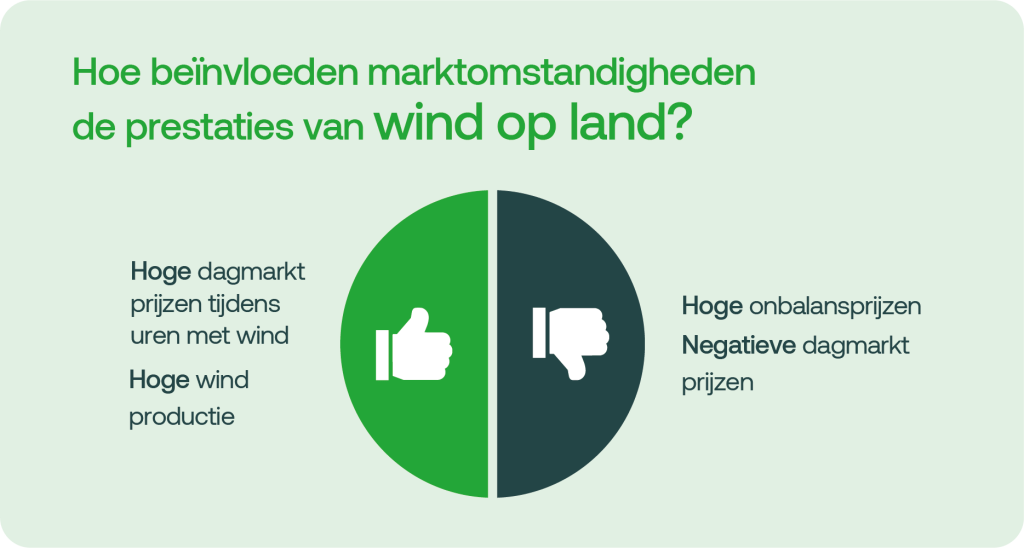
As is typical in the summer, there was little wind in July. Wind speeds increased temporarily in the middle of the month, but production remained limited over the course of the month. The average price of onshore wind energy was €75/MWh, approximately 71% of the average daily market price of €106/MWh.
Wind speeds generally increase later in the day. As a result, the electricity generated is more often sold during the higher evening rates.
Would you like to receive the market update by email?
We'll send it to you every month.
Glossary
Feeling lost in technical jargon? We're here to help.