Market Update | January 2026
Every month, we share the most important developments in the energy market. We explain how energy prices are determined, highlight trends over several months and years, and provide insight into how the market affects your energy bill.
January: a typical winter month in the energy market
January was marked by several days of severe winter weather. Snow and ice led to lower renewable energy generation, with clear regional variations. Wind power generation remained limited, and solar power generation was low and difficult to predict due to local snow showers. As a result, a large portion of the electricity generated in the Netherlands came from gas-fired power plants.
Prices remained largely stable on the day-ahead market, leaving little room for batteries to take advantage of price differentials. On the imbalance market, however, there were more opportunities than in previous months. Difficult-to-predict demand, combined with fluctuating renewable generation (due in part to snow-covered solar panels), led to additional price volatility in this market.
The day-ahead market
Intra-day market prices in January remained high, comparable to those in 2025. A large portion of electricity demand was met by gas-fired power plants, supported by limited wind generation. This resulted in a high average price and relatively small price fluctuations throughout the day.
Spot market prices
The start of the year presented a picture similar to that of 2025: high prices and low volatility. Solar power generation remained limited, meaning that most of the electricity was generated by gas-fired power plants, supplemented by wind power. This results in a high degree of price stability, which in turn limits opportunities for flexible assets, such as batteries.
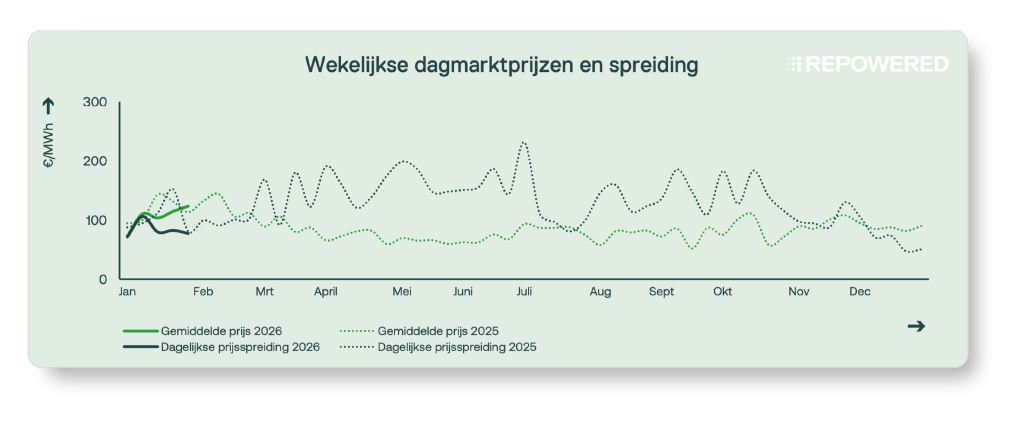
Theaverage daily price spreadis the difference between the highest and lowest quarter-hourly price on a single day. When the spread is large, the earning potential of batteries is high, because electricity can then be purchased cheaply (charging) and sold at a high price (discharging).
With an average price of €108/MWh, electricity was relatively expensive this month. This time of year is usually the most expensive, as the cost of electricity generation is closely linked to the price of natural gas. The cold winter weather in January, combined with geopolitical tensions and low natural gas inventories, put additional pressure on natural gas prices and, as a result, drove electricity prices even higher.
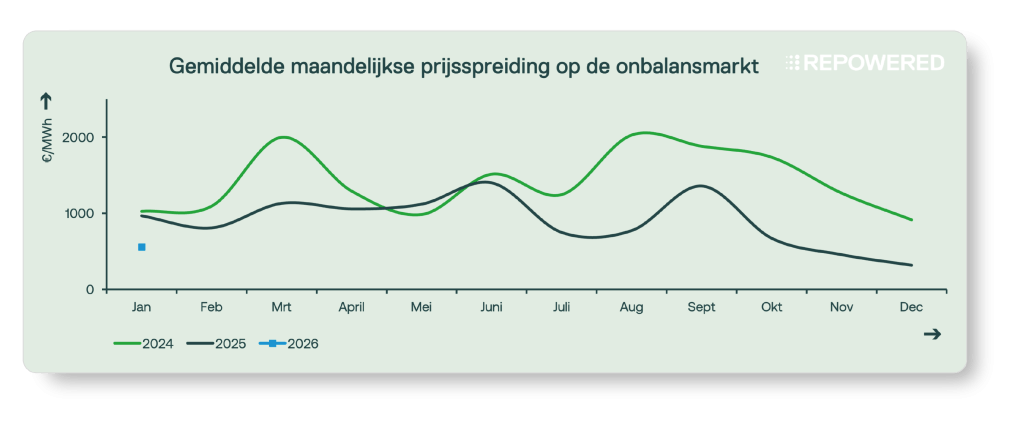
The imbalance market
The imbalance market faced more challenges this month than in previous months. The cold snap in Europe and the unpredictability of both electricity consumption and renewable generation led to higher imbalance prices. This created more opportunities for batteries to contribute to system balancing. At the same time, Picasso mitigated some of this volatility, keeping the market more stable than in previous years.
Low volatility
In January, electricity was generated primarily by gas-fired power plants. These plants provided most of the flexibility in the system and ensured stability in the balancing services. As a result, compared to previous years, there were few opportunities for flexible assets such as batteries.
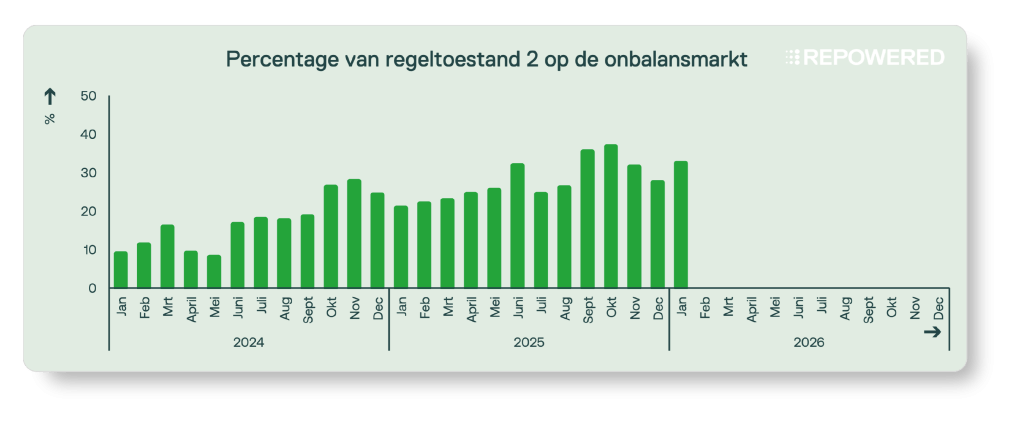
Control Mode 2
In January, there was once again an extremely high number of periods with air quality level 2, especially in the evening hours until around midnight.
The high number of quarter-hour periods with control state 2 increases the risk of passive balancing using a battery. To mitigate this risk and reduce imbalance costs, it is importantnot to respond to imbalance in an opportunistic manner. Charging or discharging should only occur when there is a clear deficit or surplus in a given quarter-hour period.
Freezing weather and snow: January 5
On January 5, the electricity price on the balancing market reached its highest level of the month. This occurred on a Monday around noon, when the price rose to €4,358/MWh.
In the first week of the year, the Netherlands experienced severe winter weather, with snow and ice covering large parts of the country. Other European countries were also affected by these weather conditions. Wind power generation remained very limited, and solar power generation was difficult to predict because many solar panels were covered in snow. This caused a significant electricity shortage, resulting in an extreme imbalance price.
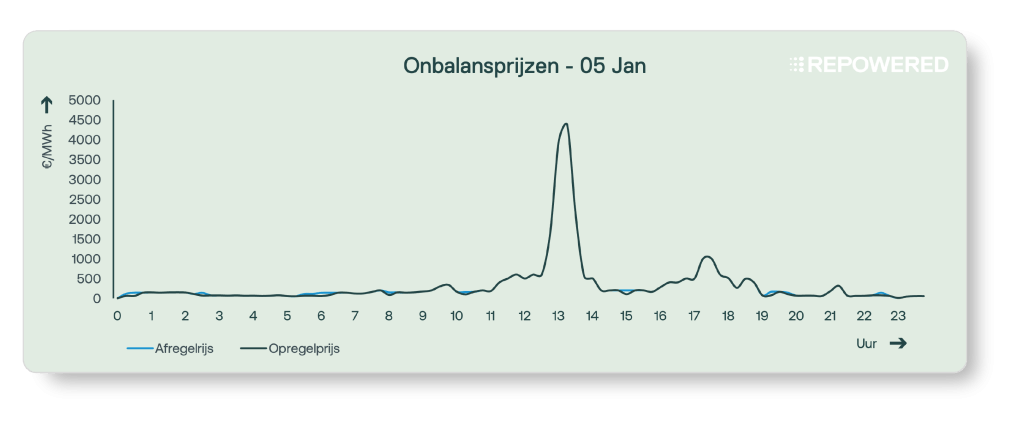
Withdrawal price:The imbalance charge for withdrawal. When there is a surplus in the system, there is a price incentive to supply less or consume more.
Feeling lost in technical jargon?
Don't worry! We've got a handy glossary ready for you👇