
Market Update | October 2026
Every month, we share the most important developments in the energy market. We explain how energy prices are determined, highlight trends over several months and years, and provide insight into how the market affects your energy bill.
We're curious…
We'd like to know what you think of ourmarket update. What do you find interesting to read? And what can we improve?Please help us by filling out a short survey.
The Energy Market in October
In October, electricity prices rose again, driven by higher gas prices. The average spot market price came in at €166/MWh. Due to the shorter days, solar power generation fell to about half the level seen in September. At the same time, the average price of solar power rose to €135/MWh, about 80% of the average spot market price.
There were 15 hours of negative electricity prices, all on October 10 and 25. These were primarily caused by strong winds. Wind power accounted for approximately 30% of total generation and had an average price of €125/MWh, about 75% of the average day-ahead market price. This was slightly higher than in September.
Daily price differences on the day-ahead market were lower than in September, averaging approximately €191/MWh. Volatility on the imbalance market remained limited, with the exception of an extreme price of €4,170/MWh on October 17. The share of control state 2 rose to approximately 50% of the quarters, reaching the highest share to date.
1 | Solar Energy
Do you generate solar energy? Then this update is for you. We’ll show you how this month’s energy prices have affected the earnings from solar installations.

1.1 | Volume and value of solar energy
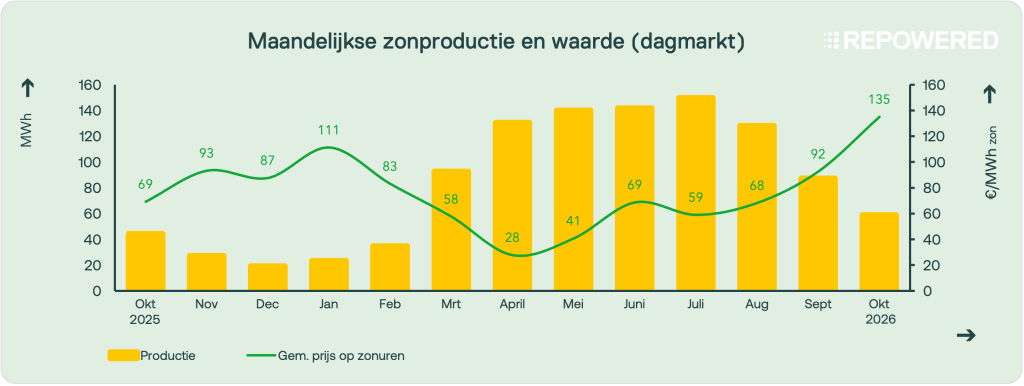
October was relatively sunny for this time of year, but wind dominated renewable energy production in the Netherlands. The sun shone mainly in the south and southeast of the country, particularly during the first week of the month. Due to the shorter days and the sun’s lower angle, both the duration and intensity of solar production decreased. As a result, total solar production amounted to nearly half the level seen in September.
The average price of solar energy was €135/MWh, approximately 80% of the average intraday market price of €166/MWh. At this time of year, solar generation is insufficient to significantly drive down intraday market prices. As a result, the price of solar energy remained relatively close to the average intraday market price.
Around October 10 and 25, electricity prices fell due to high wind power generation.
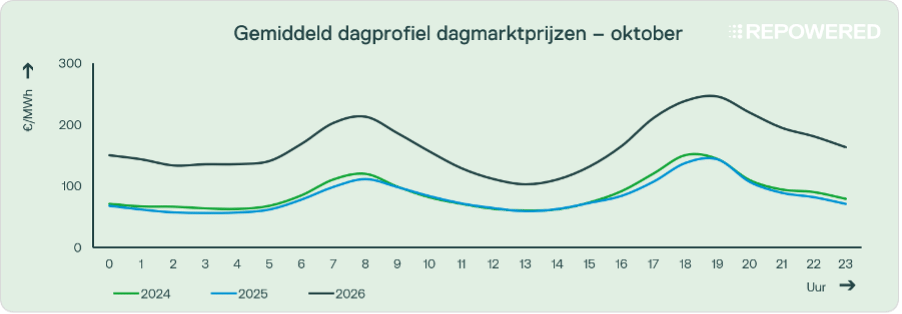
To put solar energy revenues into perspective compared to last year, it is important to examine the trend in spot market prices on the Dutch electricity market. As the graph shows, the average electricity price in October was approximately €80/MWh higher than in the same month of the previous two years.
The main reason for this is the rise in natural gas prices, which directly affects electricity prices. Over the past year, limited supply, low gas reserves, and increased competition in the energy market have contributed to higher energy prices.
1.2 | Negative prices
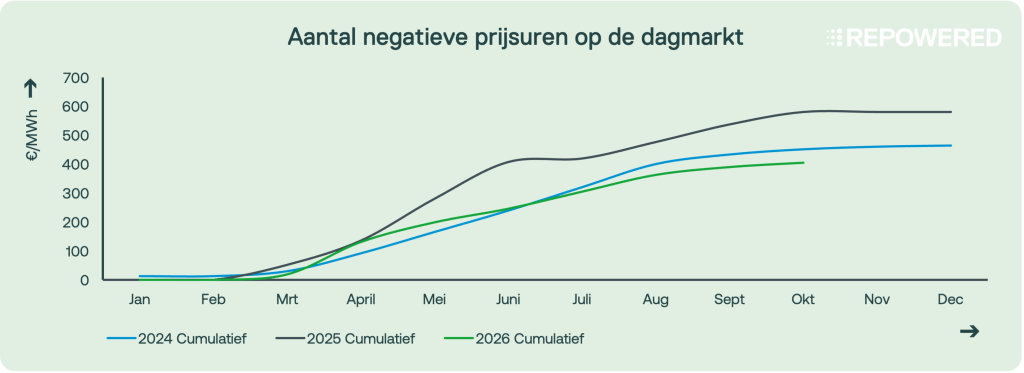
In October 2026, Dutch day-ahead market prices were negative for 15 hours. These hours occurred on two days: October 10 and 25. In both cases, high wind power generation was the main cause.
On Sunday, October 25, Storm Boelo swept across the Netherlands. The combination of strong winds and low electricity demand on Sunday led to a surplus of supply and, consequently, low prices. It was also very windy on the European mainland, resulting in a surplus of electricity in neighboring countries as well. This pushed prices in the Netherlands and neighboring countries even lower. Prices remained around or below zero for about 12 consecutive hours.
2 | Batteries
Do you have a battery? Then this update is for you. We’ll show you how this month’s energy prices have affected the earning potential of batteries.

2.1 | Day Market: Price Distribution
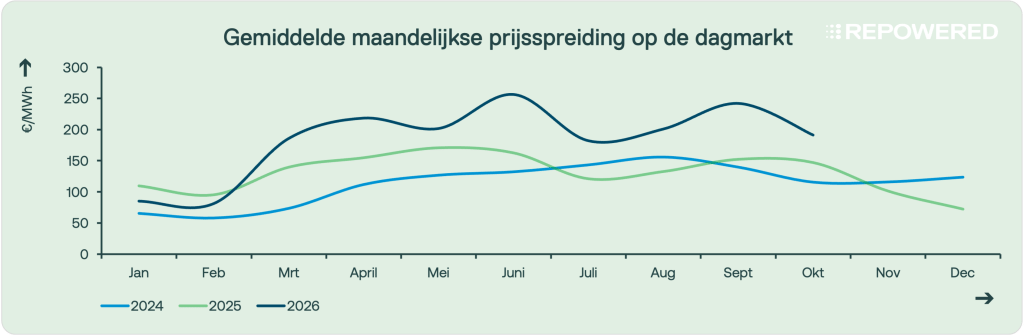
Arbitrage opportunities in the day-ahead market declined slightly this month compared to recent months. The average daily price spread was €191/MWh. Due to declining solar power generation, prices are under less pressure during the middle of the day. The merit order during this period is primarily determined by coal- and gas-fired power plants. As a result, prices remain relatively high throughout the day and may rise further during the evening peak. Price differentials are still higher than last year, mainly due to higher gas prices.
Although more wind energy was generated, wind energy is generally distributed more evenly throughout the day and is less tied to specific hours than solar energy. As a result, there are fewer significant shifts in the electricity mix during the day, and price differences are smaller. Electricity demand therefore has a greater influence on daily price fluctuations.
On days with very strong and persistent winds, such as October 25, prices may remain low for an extended period. This results in a flatter price profile and smaller intraday price fluctuations.
2.2 | Imbalance Market: Price Dispersion
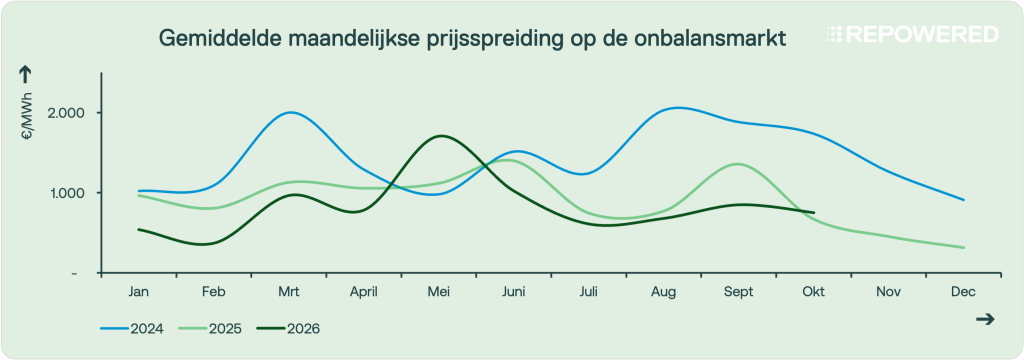
October was another weak month for batteries on the imbalance market. The average imbalance spread was comparable to that of the previous three months. An extreme imbalance occurred only on October 17.
On most days, the imbalance spread was approximately €300/MWh. On some days, it rose to €1,500/MWh. However, the quarter-hours during which these high prices occurred often ended in control state 2. As a result, batteries were unable to take advantage of these price differences, and a positive result was not possible.
For much of the month, the system was in control state 2 or there was a shortage. This means that less electricity was generated or more was consumed than expected, resulting in an imbalance.
2.3 | Imbalance Market: Control State 2
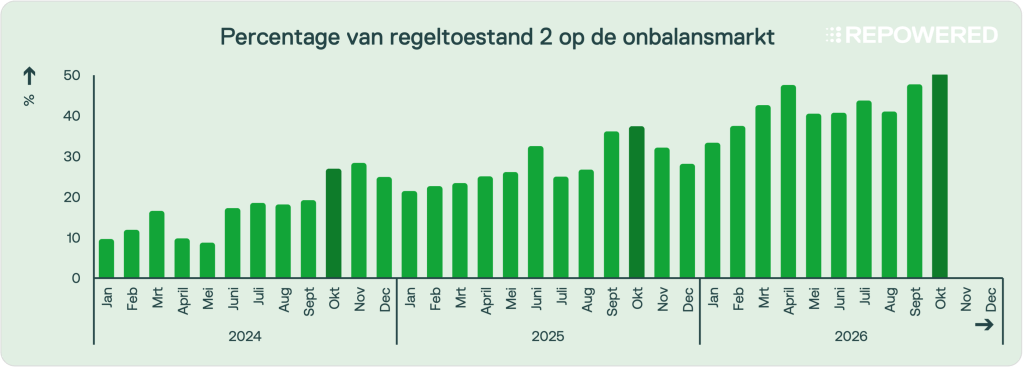
In October, control state 2 occurred in approximately 50% of all quarters (ISPs). This is the highest proportion ever recorded. Historical data show that control state 2 tends to increase more frequently during the fall months.
3 | Onshore Wind
Do you generate onshore wind energy? If so, this update is for you. We’ll show you how energy prices this month have affected the earnings of onshore wind farms.
3.1 | Volume and Value of Wind Energy
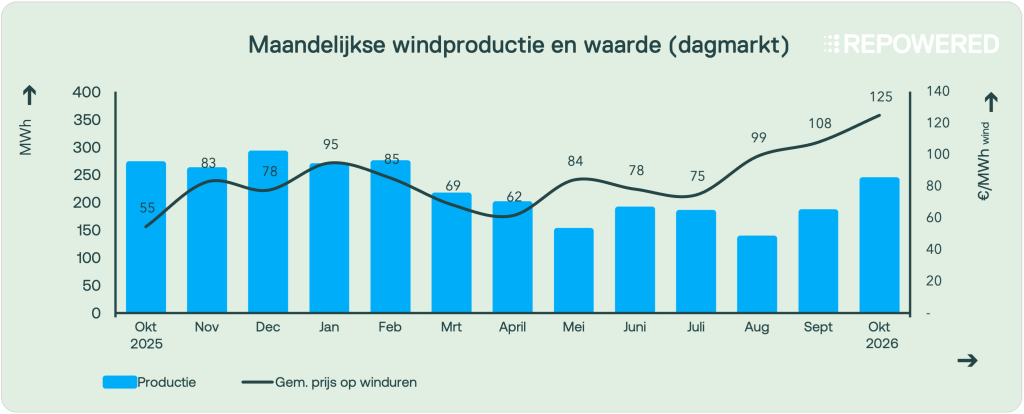
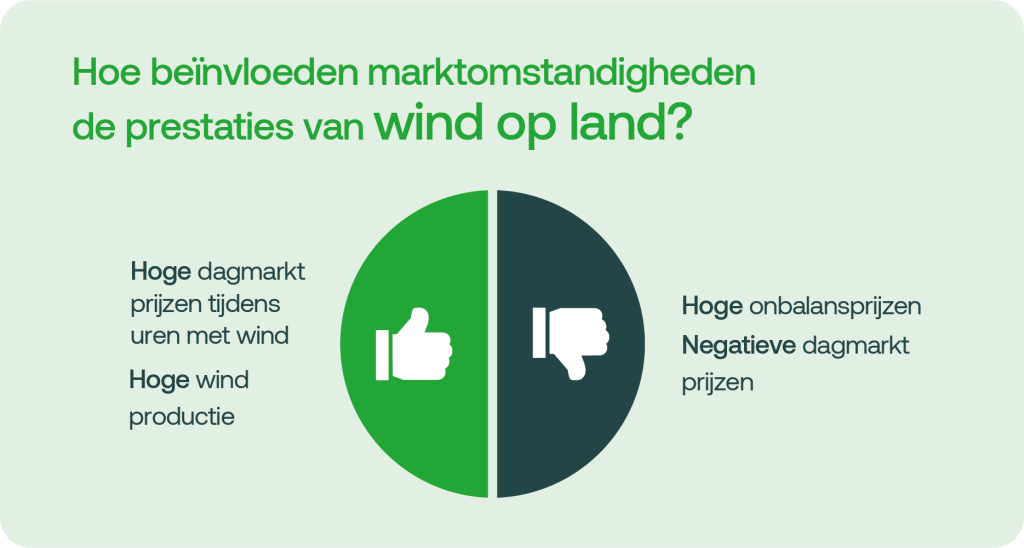
Wind energy accounted for approximately 30% of total electricity generation in the Netherlands this month. With the exception of the first week, October was a windy month. The average price of wind energy was €125/MWh, about 75% of the average daily market price of €166/MWh. This was slightly higher than in September, in line with the general rise in electricity prices.
On some days, wind power generation was so high that it drove down electricity prices. This also had a downward effect on the value of wind energy. Wind also played a notable role on a few specific days. On October 17, offshore wind turbines were slowed down due to bird migration. From October 23 through 25, storms Austen and Boelo brought strong winds.
Would you like to receive the market update by email?
We'll send it to you every month.
Glossary
Feeling lost in technical jargon? We're here to help.