
Market Update | September 2026
Every month, we share the most important developments in the energy market. We explain how energy prices are determined, highlight trends over several months and years, and provide insight into how the market affects your energy bill.
We're curious…
We'd like to know what you think of ourmarket update. What do you find interesting to read? And what can we improve?Please help us by filling out a short survey.
The Energy Market in September
Electricity prices rose in September, partly due to rising gas prices. The average day-ahead market price came in at €152/MWh. Due to the shorter days, solar production declined, but solar farms were well compensated on average at approximately €92/MWh. That is about 60% of the average spot market price. There were 27 hours with negative prices, significantly fewer than in previous months.
Onshore wind energy production was slightly higher than in August, but remained below last fall’s level. Wind energy was valued at an average of €108/MWh, approximately 70% of the day-ahead market price. This made the value of wind energy the highest in recent months, mainly due to higher market prices.
Price differences on the day-ahead market were also significant. The spread amounted to approximately €242/MWh, mainly due to high prices in the morning and evening. The imbalance market remained relatively stable, with fewer major price spikes. Control state 2 occurred in approximately 46% of the quarters.
1 | Solar Energy
Do you generate solar energy? Then this update is for you. We’ll show you how this month’s energy prices have affected the earnings from solar installations.
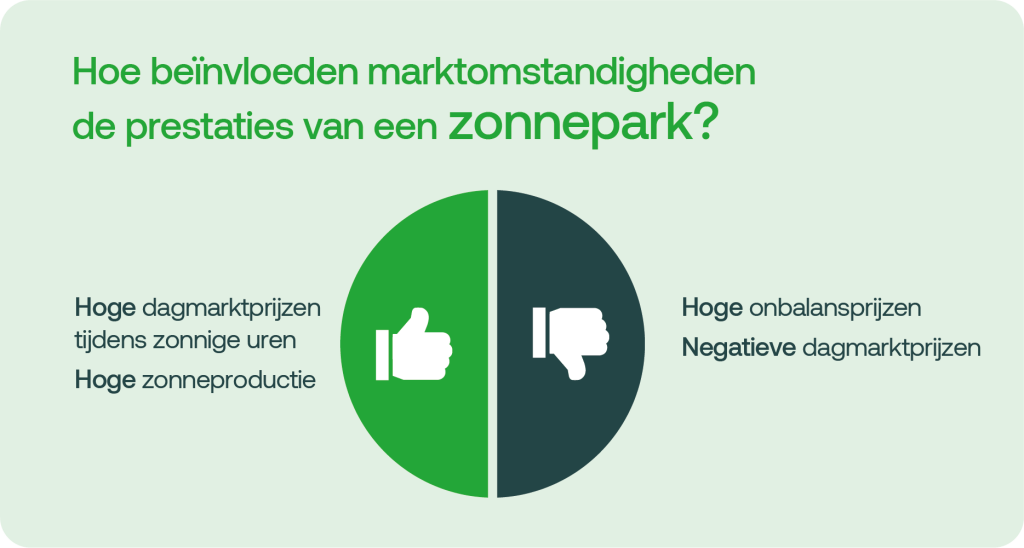
Solar farms received an average of €92/MWh in September. This is approximately 60% of the average daily market price of €152/MWh. Solar generation continued to decline due to shorter days and lower sun elevation. At the same time, the lower generation meant that solar farms were paid relatively well per MWh generated. On many days, generation during daylight hours was too low to significantly depress prices. In total, there were 27 hours with negative prices.
1.1 | Volume and value of solar energy
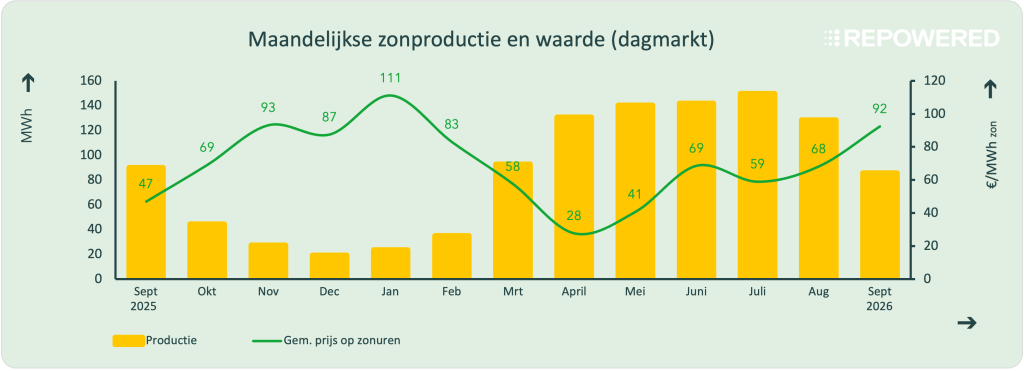
September was still a relatively sunny month throughout the Netherlands. Nevertheless, solar production continued to decline. The shorter days and lower sun angle, combined with slightly fewer hours of sunshine than in August, led to a noticeable drop in production.
Solar farms received an average of approximately €92/MWh for the electricity they generated. That is about 60% of the average daily market price of €152/MWh. On several days, solar generation during daylight hours was not high enough to significantly drive down electricity prices. As a result, prices remained relatively high and fell only slightly below €100/MWh during those hours. The higher market prices thus contributed to a relatively high value for solar energy, despite declining generation.
1.2 | Negative prices
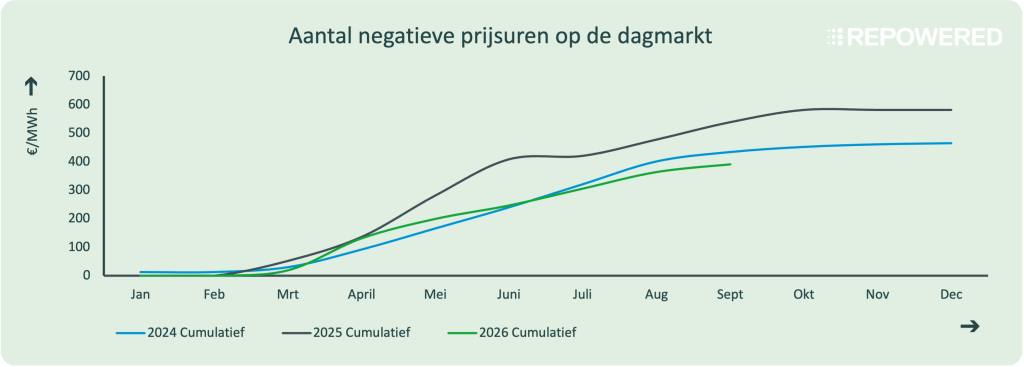
In September, there were 27 hours with negative prices, slightly fewer than in previous months. Of those, 20 hours occurred during consecutive periods of more than six hours. As a result, some solar farms lost their eligibility for the SDE subsidy for those hours.
2 | Batteries
Do you have a battery? Then this update is for you. We’ll show you how this month’s energy prices have affected the earning potential of batteries.
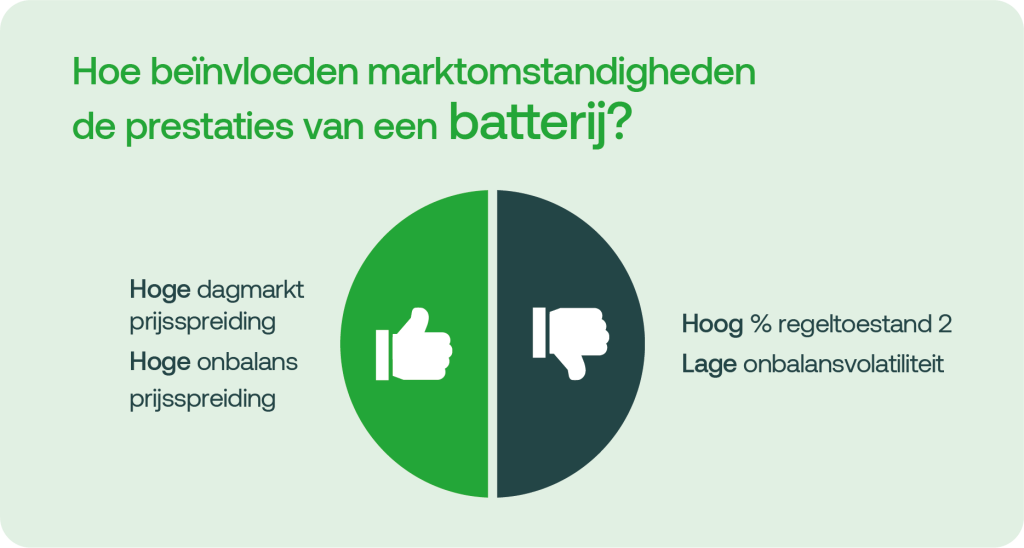
For batteries, September offered more opportunities on the day-ahead market than on the imbalance market. Price differentials on the day-ahead market were significant, averaging about €242/MWh. On about half of the days, the spread was of this magnitude.
Unlike in the summer, the large price differences were mainly caused by high prices in the morning and evening, rather than low prices in the afternoon. Due to higher gas prices and shorter days, gas-fired power plants determined the market price for more hours.
The imbalance market remained relatively calm. On only 7 days did the daily price spread exceed €1,000/MWh. Price spikes are increasingly being mitigated by the operation of PICASSO. Control state 2 was active approximately 46% of the time.
2.1 | Day Market: Price Distribution
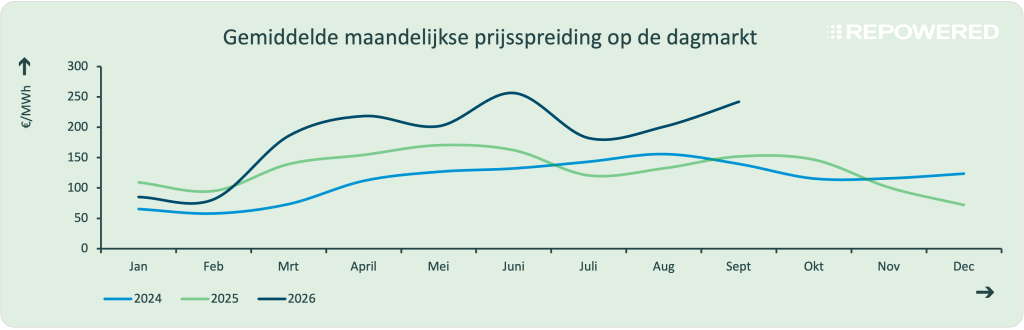
Arbitrage opportunities in the day-ahead market were strong in September. The average price spread came in at €242/MWh, with a spread of this magnitude occurring on about half of the days. We saw a similar situation in June, when heat waves led to low prices during daylight hours and high prices in the evening due to high demand for cooling.
The cause was different this month. The large price differences were not due to low midday prices, but mainly to exceptionally high prices during the morning and evening peak hours. Higher electricity prices in the fall are linked to rising gas prices. Because gas-fired power plants are often needed to meet demand during peak hours, higher gas prices are directly reflected in the price of electricity.
The shorter days also play a role here. Solar power generation declines earlier in the day, meaning that gas-fired power plants are needed sooner and set the market price for more hours. As a result, there were significant price differences in September between the morning and evening on the one hand, and the hours in between on the other.
2.2 | Imbalance Market: Price Dispersion
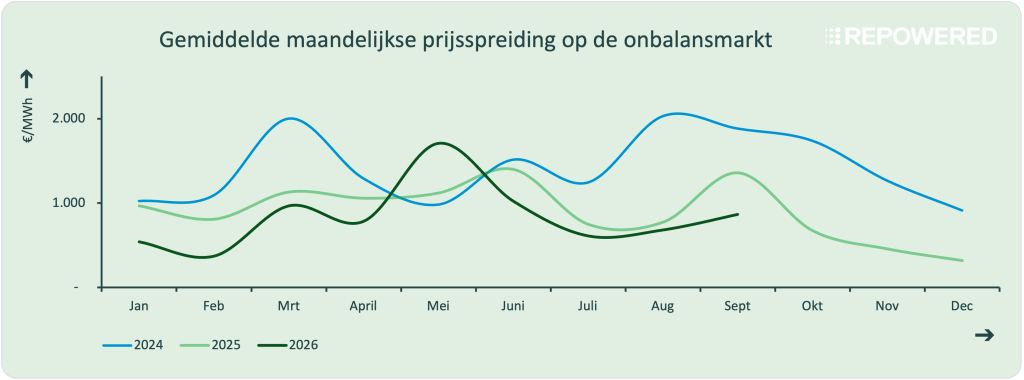
September was another weak month for batteries on the imbalance market. The average imbalance spread was comparable to August and was only slightly higher due to a few price extremes.
The daily imbalance spread exceeded €1,000/MWh on only 7 days. By comparison, there were 12 such days in September 2024 and 19 in September 2025.
A key reason for this is PICASSO, the European platform for the exchange of aFRR balancing energy. Since TenneT began participating in this platform, imbalances can more often be resolved using less expensive foreign bids. As a result, very expensive Dutch bids are needed less frequently, and price spikes in the imbalance market are mitigated. It is precisely these price spikes that are important for the revenue potential of batteries in this market.
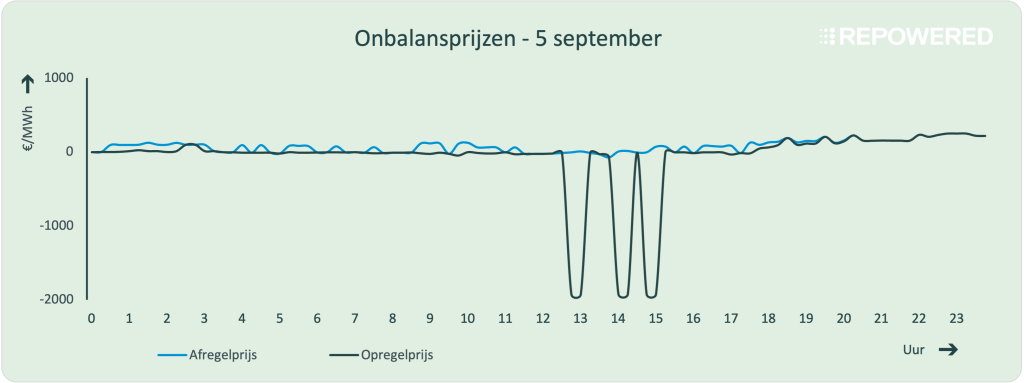
On September 5, the imbalance market closed at -€2,000/MWh six times during control state 2. Such extreme negative prices normally indicate a large surplus of electricity. That was not the case this time.
The price was caused by an incorrectly placed bid on the aFRR balancing market. This resulted in a situation known asreverse pricing. In this situation, the imbalance price is based on the so-calledmidprice, which came in at around -€2,000/MWh.
A market participant offered to pay €4,000/MWh to supply upward-regulating balancing energy. This is highly unusual. Providers of balancing services normally expect to be paid for supplying this energy, not to pay such an extreme amount for it. The extreme prices were therefore the result of a bidding error and not of the actual situation on the power grid.
2.3 | Imbalance Market: Control State 2
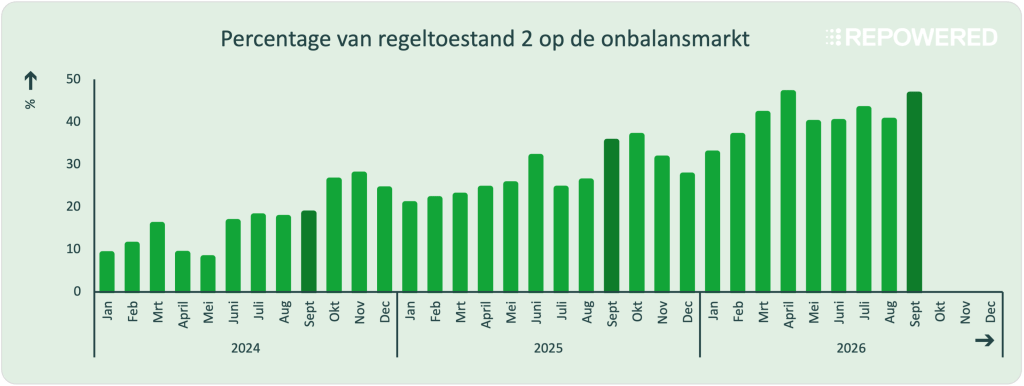
Regulation State 2 occurred in approximately 46% of all quarters (ISPs) in September, slightly more than in previous months. These situations occurred throughout the month and at all hours of the day.
Parties with a deficit—that is, those that produced less or consumed more than expected—faced the highest imbalance charges during these quarters. On average, these charges amounted to approximately €175/MWh, well above the level of the previous months.
3 | Onshore Wind
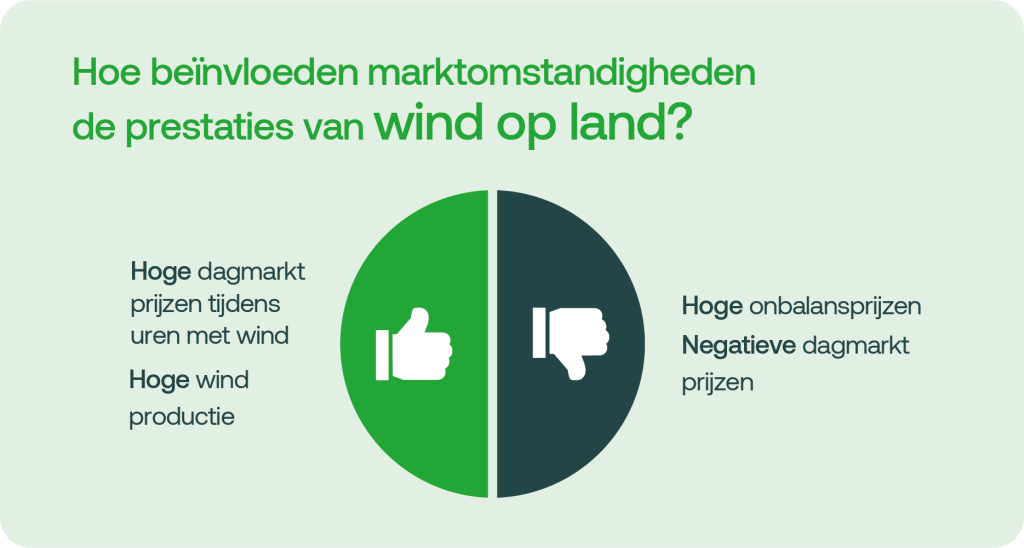
Do you generate onshore wind energy? If so, this update is for you. We’ll show you how energy prices this month have affected the earnings of onshore wind farms.
3.1 | Volume and Value of Wind Energy
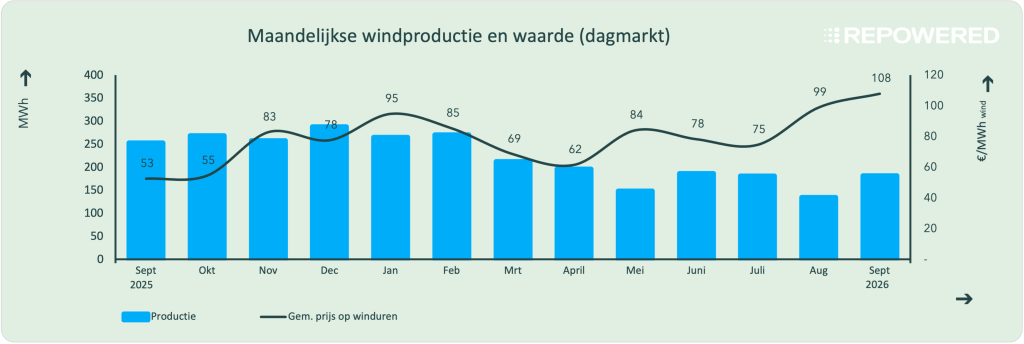
This month was slightly windier than August, while wind power generation was lower than usual for last fall. Wind power was valued at an average of €108/MWh, about 70% of the average day-ahead market price of €152/MWh. Wind generation increased in the afternoon, peaking around 6:00 p.m. This coincided with the time when day-ahead market prices began to rise as the more expensive evening hours approached.
The value of wind energy was thus the highest it had been in recent months. This was mainly due to higher electricity prices. In September 2025, the value of wind energy was about half that of September 2026. The average daily market price at that time was also about half of this year’s level. The higher value of wind energy is therefore primarily due to higher market prices and not so much to higher wind production.
Would you like to receive the market update by email?
We'll send it to you every month.
Glossary
Feeling lost in technical jargon? We're here to help.