Year-End Market Update | 2025
In this special market update, we look back at the energy market in 2025. We examine the impact of external factors, market changes, the energy mix, and price fluctuations in the day-ahead and imbalance markets. At the same time, we assess the market value of flexible generation facilities and provide a preview of 2026.
External factors that influenced energy prices
In 2025, a number of external factors had a significant impact on energy prices.
Due to the continued growth of solar and wind energy, electricity prices have become increasingly dependent on the weather. During periods of strong sunshine or wind, prices are low, whereas when generation is low, the market has had to rely on fossil fuel power plants. During those hours, the price of electricity was primarily determined by the use of gas-fired power plants and, consequently, by the price of gas.
The gas market therefore continued to drive pricing during periods of scarcity. Gas prices rose in early 2025, partly because Europe stopped importing Russian gas at the end of 2024 and shifted its focus more toward LNG imports. Gas prices fell again in the second half of the year.
In addition, temperature plays a major role in energy demand. 2025 saw generally mild weather conditions, with a warm winter and spring and relatively more sunshine compared to the previous two years.
Finally, the impact of the European Emissions Trading System (ETS) also increased. The price of CO₂ rose in 2025 compared to 2024, particularly in the final months of the year. This made electricity generation from fossil fuel power plants more expensive, which led to higher prices during periods of low solar and wind availability.
Major market changes
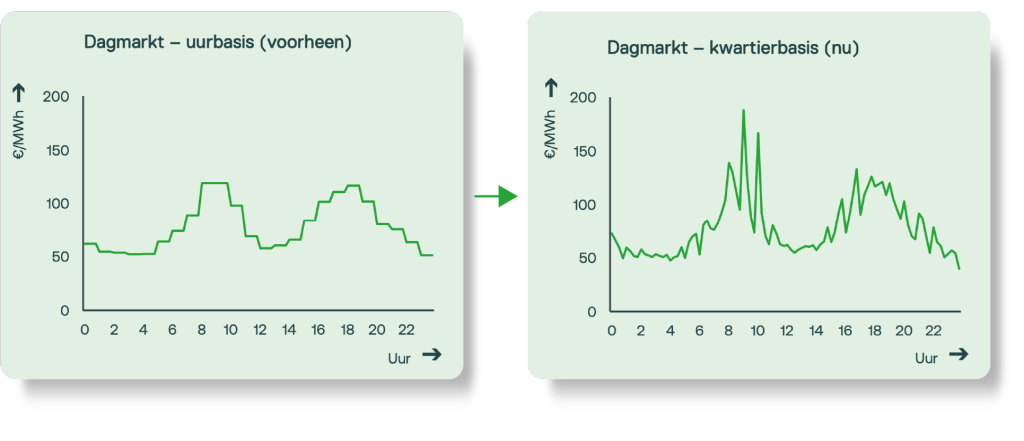
Day-Ahead Market: From Hourly to 15-Minute Prices
As of October 1, the day-ahead market has switched from hourly prices to 15-minute prices. This means that a day no longer consists of 24, but of 96 pricing intervals. By setting prices more frequently, the value of electricity better reflects the current situation on the power grid. As a result, the electricity price more accurately reflects the actual value of electricity at every moment of the day.
aFRR: From 24-Hour to 4-Hour Blocks
Since November 10, the blocks for automatic frequency restoration (aFRR) have been shortened from 24 hours to 4 hours, resulting in six blocks per day. Whereas previously power had to be kept available for an entire day, this can now be done on a per-block basis. This lowers the threshold for participation with flexible installations, such as batteries, renewable generation, and electric boilers. This change makes the balancing process more flexible and efficient.
Greater transparency in the balancing process
In 2025, TenneT took significant steps to make the balancing process more transparent. The delay in publishing the balance delta was reduced from 5 to 2 minutes in July. In addition, since November, TenneT has been publishing the balance delta every 12 seconds instead of once per minute. These improvements provide market participants with faster and more accurate insight into the current balance situation on the electricity grid.
The day-ahead market
The energy mix over the past three years
To fully understand how the energy market functioned in 2025 and what changes occurred, we will first examine the overall energy mix over the past three years. The graph below shows that the share of renewable energy has increased.
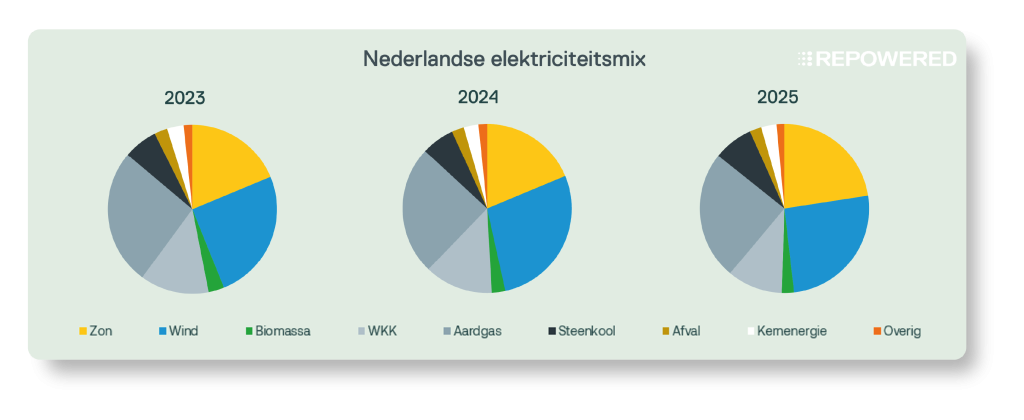
The increase in solar energy production is due, among other things, to the installation of nearly 3 GWp of new solar panels and the fact that 2025 was a relatively sunny year. Wind energy production, on the other hand, fell short of last year’s levels, mainly due to lower average wind speeds. Due to this combination of factors, the share of renewable electricity in 2025 will again be around 50%, comparable to 2024.
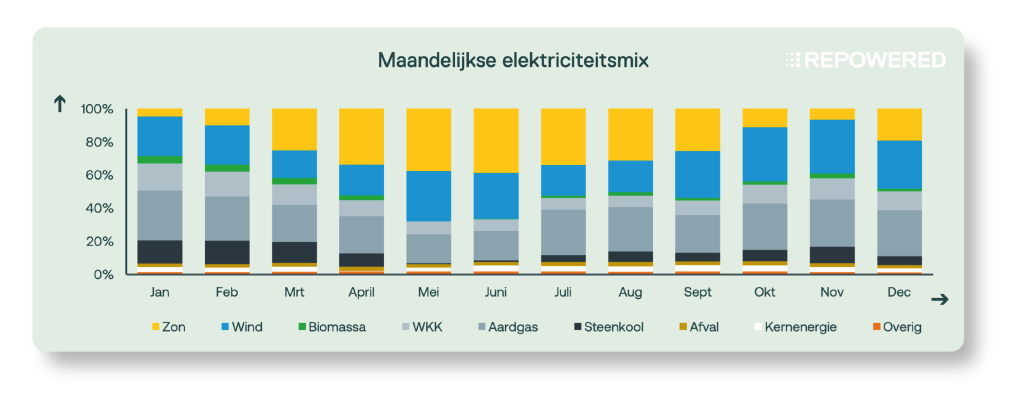
The energy mix in 2025
The energy mix varies significantly throughout the year, as shown in the graph below. In the following sections, we will examine the energy mix on a quarterly basis and analyze its impact on spot market prices.
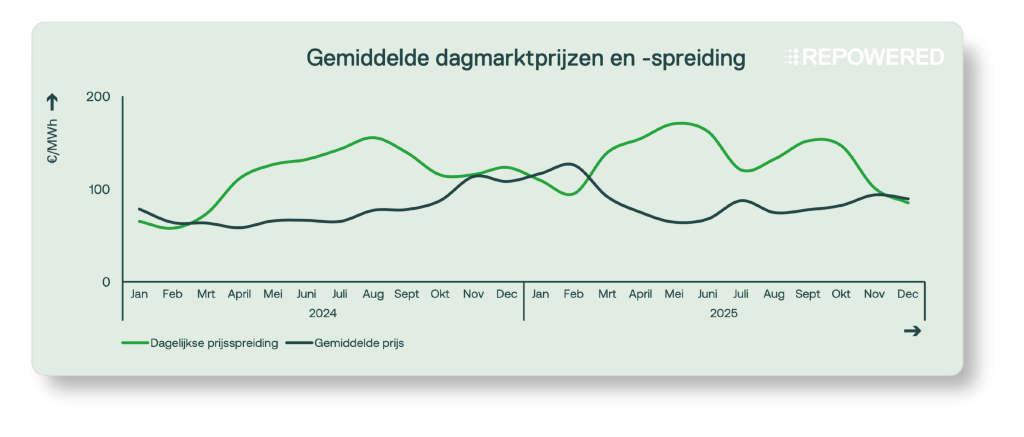
Thedaily price spreadis the difference between the highest and lowest quarter-hourly price on a single day. When the spread is large, the earning potential of batteries is high, because electricity can then be purchased cheaply (charging) and sold at a high price (discharging).
Data has been included through mid-December 2025.
January–February
In early 2025, wind power generation was low, resulting in a relatively high demand for electricity from gas and coal-fired power plants. The limited output from solar and wind power led to severalperiods of “dunkelflaute”: periods of low renewable energy production. At the same time, gas prices were high due to the shift from Russian gas to LNG.
This resulted in high electricity prices at the start of the year, averaging €110/MWh. Intraday price volatility remained low, which is often the case when a large portion of generation comes from fossil-fuel power plants that can produce continuously at a stable cost.
March–June
Low wind power generation continued into the spring, but was largely offset by a large amount of solar energy. The spring of 2025 was among the sunniest on record. In May and June, the share of renewable energy in the energy mix even rose above 60%.
Due to the abundance of solar energy, prices dropped significantly in the middle of the day, while they remained higher in the morning and evening. The large daily price fluctuations clearly indicate that there is still a lack of short-term flexibility.
July–August
The sunny trend continued into the summer months, with the exception of July. In addition, 2025 saw a hot summer with two heat waves: one in early June and one in mid-August. During these periods, temperatures were high both day and night, there was plenty of solar energy around noon, and wind power generation was disappointing. As a result, gas-fired power plants had to ramp up to meet the energy demand for cooling.
This led to significant price fluctuations on certain days in June and August, with a wide average price range. July was an exception: less sunshine and more stable prices, with no negative fluctuations. This stands in stark contrast to 2023 and 2024, and is reflected in the average price, which rose in July.
September–December
In the fall, wind power generation and the share of wind energy increased, with September, October, and November being the windiest months of 2025. At the same time, solar power generation gradually declined due to shorter days, causing the share of gas and coal-fired power plants in the energy mix to increase.
The combination of wind and solar power led to price volatility. On sunny afternoons, there were significant price differences between midday and evening, and windy weekends resulted in longer periods of low prices. In late October and early November, prices rose because conventional power plants had to operate more frequently, but on average, prices remained lower than last year, partly due to the extremely high gas prices in December 2024.
Negative prices
The predominantly sunny year once again resulted in a record number of hours with negative energy prices: a total of 581 hours. There were also more 6-hour blocks with negative prices, which meant that solar farms with an SDE decision issued in 2016 or later received less subsidy. Through December, this totaled 385 hours, compared to 282 hours in 2024 and 171 hours in 2023.
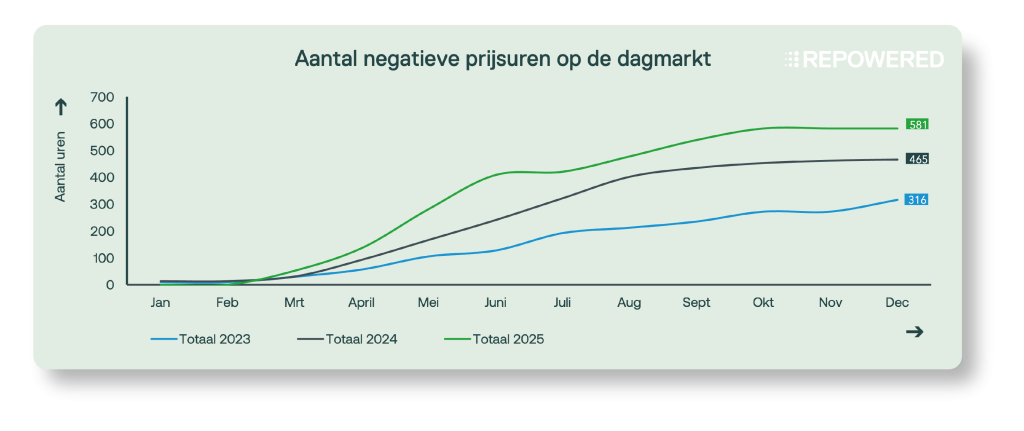
Even though the day-ahead market has switched to quarter-hourly intervals, we continue to use hours rather than quarter-hours for the sake of clarity.
Data has been included through mid-December 2025.
The imbalance market
Overview of Regulatory Statuses for 2023, 2024, and 2025
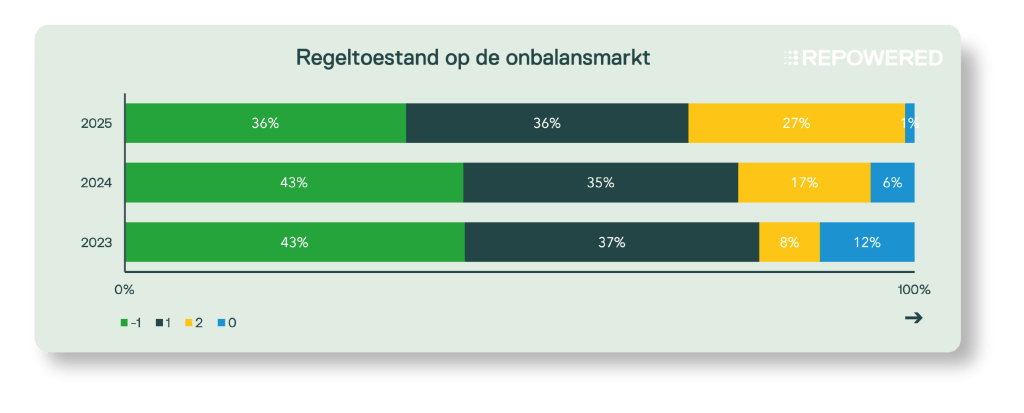
-1= surplus 1 = deficit 2= both deficit and surplus 0= no imbalance
The data is included through mid-December 2025.
Control state 2 has grown by approximately 10% per year and has tripled since 2023 to nearly 30%. TenneT refers to control state 2 when both a deficit and a surplus occur during a 15-minute Imbalance Settlement Period (ISP). In this situation, everyone has an imbalance position, and TenneT charges all parties for the costs. In these situations, it is impossible to achieve a positive result using a battery via passive balancing.
It is also notable that control state 0 has virtually disappeared. This means that the system rarely experiences periods without imbalance, and TenneT must activate balancing services nearly every 15 minutes.
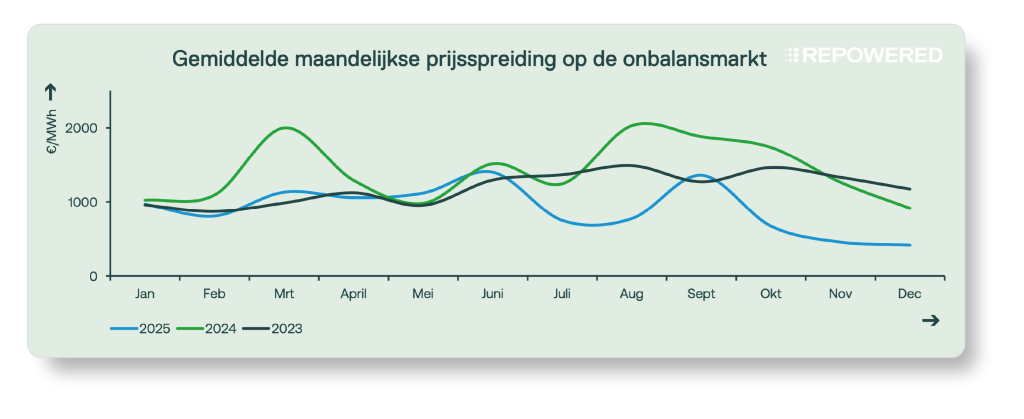
Imbalance spreads
Over the past year, volatility in the imbalance market has decreased significantly compared to previous years. As a result, balancing has become less expensive, partly thanks to the interconnection with other countries via PICASSO. Since October 2024, TenneT has been participating in this European partnership, which coordinates imbalance positions between neighboring countries. This increase in scale allows balancing energy to be activated at lower costs, which has led to a decrease in imbalance prices.
Extreme prices
Spike prices are lower and less volatile in 2025, with only a few very extreme prices compared to previous years. These extreme prices occurred on a few occasions and were 2 to 3 times higher than in 2023 and 2024, reaching a record of €5,500/MWh on October 25.
This is clearly shown in the graph below, which ranks imbalance prices from highest to lowest, focusing on the top 5% of prices for 2023, 2024, and 2025. The 2025 line starts at €5,500/MWh but drops rapidly. There were 200 quarter-hours during which the imbalance price exceeded €1,000/MWh. By comparison: in 2023 and 2024, the highest prices ranged between €2,038 and €2,888/MWh, but there were approximately 500 quarter-hours above €1,000/MWh. That is more than double this year’s figure.
A similar trend is also evident in the lowest imbalance prices, which reflect the costs of activating and deactivating power: these have become less expensive.
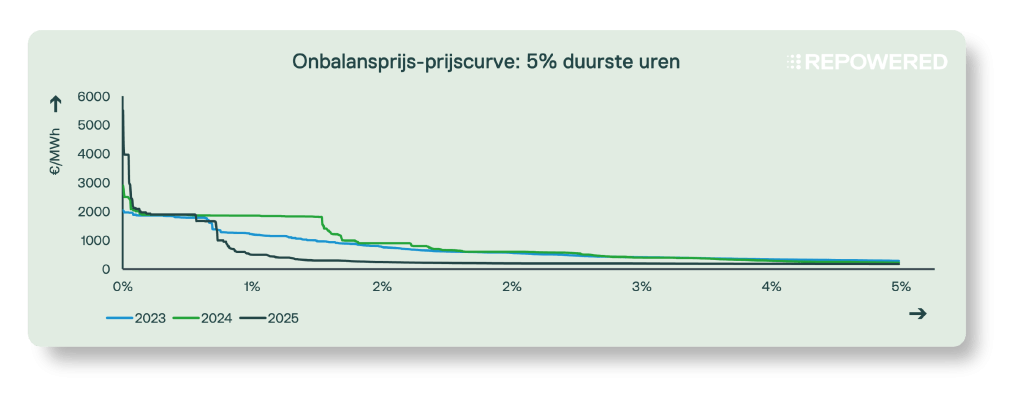
The data includes figures through mid-December 2025, and includes quarter-hourly periods with control state 2.
Market Value of Solar Energy in 2025
This section provides an overview of the market value of solar energy over the past three years. We show how market prices affect revenue,withouttaking into accountstrategic management practices such as curtailment or bidding strategies.
| 2023 | 2024 | 2025 *** | ||
|---|---|---|---|---|
| Production | Full-load hours [hours] * | 950 | 928 | 976 |
| Daily Market | Average price [€/MWh] | 96 | 77 | 87 |
| Average price per hour of sunshine [€/MWh] ** | 68 | 41 | 43 | |
| Capture rate [%] | 71% | 53% | 49% | |
| SDE++ | # hours with negative prices [#] | 316 | 465 | 581 |
| # 6-hour blocks with negative prices [#] | 171 | 282 | 385 | |
| Imbalance costs | Average imbalance costs in the event of a shortfall [€/MWh] | 13 | 27 | 14 |
** The average price on the day-ahead market when solar energy is generated.
*** Prices through mid-December 2025.
A few conclusions
Sunny year leads to high production
Compared to last year, more solar energy was produced, mainly due to the sunny weather in 2025.
The value of solar energy has fallen significantly
The average selling price of solar energy on the day-ahead market fell significantly compared to 2023: from €68/MWh to €41–43/MWh in 2024 and 2025. This is also reflected in the capture rate, the ratio between the average day-ahead market price and the actual price at which solar energy is sold.
The number of hours with negative prices has increased again
In 2025, there were 581 hours with negative prices—nearly double the number in 2023—accounting for approximately 7% of the year. Negative prices are increasingly occurring in consecutive blocks of 6 hours or longer, causing even older solar parks with SDE++ subsidies to lose revenue.
Reports Lower Average Imbalance Costs The average imbalance costs in the event of a shortfall have roughly halved compared to last year.
Market value of batteries in 2025
This section provides an overview of the market value of batteries, based on electricity prices over the past three years. The table below provides an indication of the revenue potential based on market prices,noton a specific operational strategy.
| 2023 | 2024 | 2025 ** | ||
|---|---|---|---|---|
| Daily Market | Average daily price spread* [€/MWh] | 108 | 113 | 130 |
| Imbalance Market | Average daily price spread* [€/MWh] | 765 | 855 | 517 |
| Control status 2 [%] | 8% | 17% | 28% |
** Data through December 2025.
A few conclusions
Earning potential in the day-ahead market has grown
The difference between the highest and lowest prices in a single day continues to widen. These price differences arise from sharp transitions from hours with high renewable generation to periods when the system relies primarily on gas-fired power plants. This increases the need for short-term flexibility to better align the supply of primarily solar energy with the high demand in the evening. Batteries can respond effectively to this and generate stable revenue by charging during off-peak hours and discharging during peak hours.
Earning potential in the imbalance market has declined
Volatility in the imbalance market has fallen sharply. Compared to last year, the price spread has narrowed by 35%. As previously explained, PICASSO has made the balancing process more efficient, leading to less extreme prices.
Increased risk in the imbalance market due to control state 2
The increase in control state 2 heightens the risk associated with participating in passive balancing. In this situation, imbalance charges are always applied, which has a significant impact on battery revenue.
A Look Ahead to 2026
Looking ahead, the Dutch energy market will become increasingly integrated with European markets. This makes it more important to leverage flexibility in wholesale markets, such as the day-ahead and intraday markets, while balancing markets (FCR, aFRR, and passive balancing) are becoming less attractive due to their limited size.
During the colder months, the system remains heavily dependent on gas-fired power plants, keeping electricity prices linked to LNG imports, gas storage, and the global gas market. At the same time, the need for flexibility is increasing to absorb and utilize the supply of large volumes of renewable energy during periods of high demand.
The importance of flexibility through storage, demand response, and cross-border balancing will become increasingly significant. Renewable sources are also becoming more flexible and utilizing new revenue models, for example through strategic curtailment and participation in multiple markets simultaneously.
Sources
- KNMI: Climatology
- CBS: Installed capacity, electricity mix in 2024, imported and exported electricity
- National Energy Dashboard: Electricity Mix
Feeling lost in technical jargon?
Don't worry! We've got a handy glossary ready for you👇