Market Update | October 2025
Every month, we share the most important developments in the energy market. We explain what the figures mean, identify trends over several months and years, and provide insight into how the market affects your energy bill.
October: A New Rhythm at the Market
October brought a significant change: the day-ahead market switched to 15-minute prices. As a result, prices fluctuate more rapidly, creating new opportunities for flexible assets, such as batteries. Wind energy production once again led to many hours of negative prices. In addition, the Netherlands has now been participating in PICASSO for one year, allowing us to clearly see the effect of this European collaboration on the imbalance market. Overall, there were again few major outliers, and the number of 15-minute intervals with control state 2 remained high at 36%: a level that now feels like the new normal.
The day-ahead market
The switch to quarter-hourly pricing clearly shows how quickly electricity prices can fluctuate within a single hour. In addition, strong winds at the beginning and end of the month led to prolonged periods of low or even negative prices.
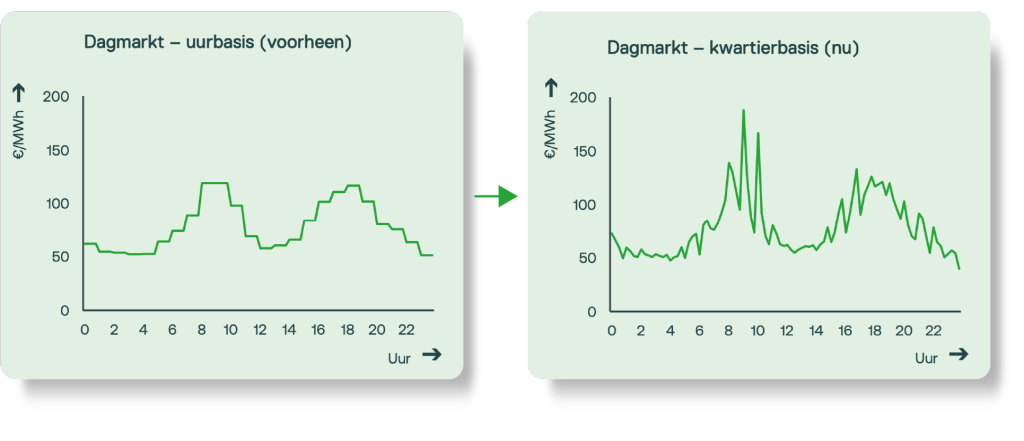
Switch to 15-minute pricing
As of October 1, the day-ahead market has switched from hourly prices to 15-minute prices. This is a significant step for the European energy system: a day now consists of 96 price points instead of 24. By setting prices more frequently, the value of electricity better reflects the current situation on the grid. In an increasingly sustainable energy system, the supply of electricity can change rapidly, for example due to weather conditions. With 15-minute prices, the price now better reflects the actual value of electricity at that moment.
The transition also leads to greater volatility. There are more price fluctuations that can vary significantly from one another. This benefits flexible assets, such as batteries, which can respond quickly to changes in supply and demand.
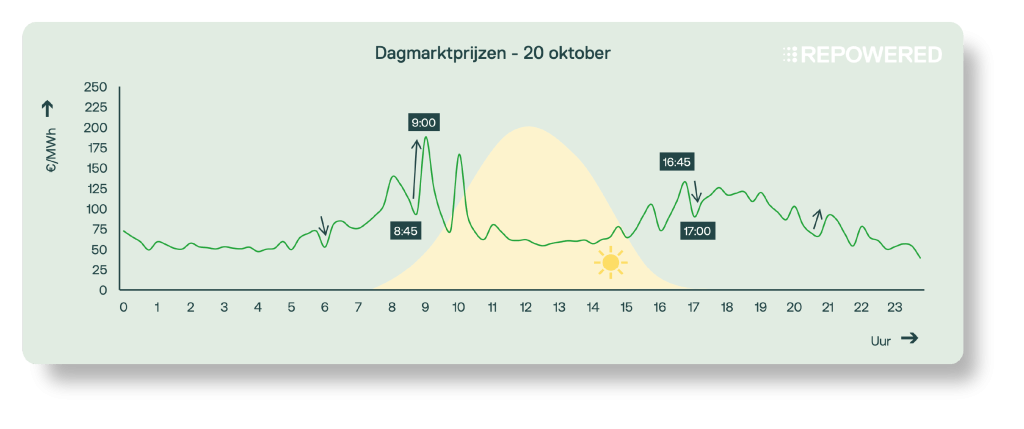
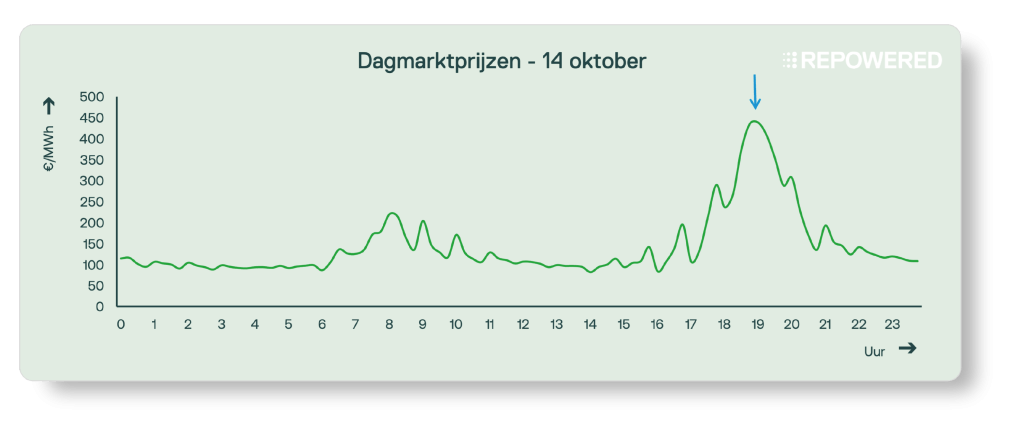
Since October 1, it has become clear that prices can fluctuate significantly within a single hour. A good example is October 20, when the electricity price fluctuated continuously between consecutive 15-minute intervals (see graph: Day-Ahead Market Prices – October 20). The highest price this month was on October 14 from 7:00 p.m. to 7:15 p.m., when the price peaked at €437/MWh.
A sawtooth pattern in quarter prices: October 20
Since the introduction of quarter-hourly prices, a sawtooth pattern has been observed on a regular basis. For example, on October 20. Prices rise or fall from the first to the fourth quarter of every hour. This is because there are (still) market participants who place their bids on an hourly basis rather than on a quarter-hourly basis. As a result, the balance between supply and demand shifts significantly at the start of each hour, which is reflected in rapidly rising or falling prices. The available transmission capacity to other countries is also determined on an hourly basis, which contributes to these price fluctuations.
The effect is visible throughout the day, but is most pronounced during periods of frequent load balancing in the morning and late afternoon/early evening. The system switches between renewable (solar) and fossil fuel-based generation, as well as between periods of high and low demand.
The impact of wind on spot market prices
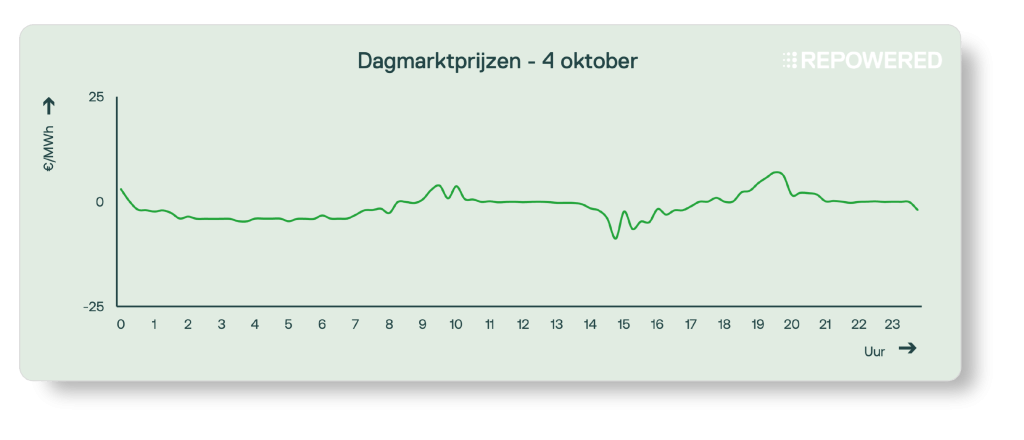
Wind energy had a major impact on prices this month. There were particularly strong winds at the beginning and end of October, which led to prolonged periods of low prices, such as on October 4. The price remained between -€10 and €10/MWh throughout the day. This is an unusual situation that does not occur often.
Highest peak price on October 14
In the middle of the month, there was less generation from renewable sources, which meant that prices were primarily driven by conventional power plants (such as gas). The exception was October 14, when a sharp price spike occurred around 7:00 p.m. due to high demand and low supply of renewable energy. Otherwise, prices remained fairly stable during this period. As a result, despite the switch to quarter-hourly pricing, we see no increase in the average price spread.
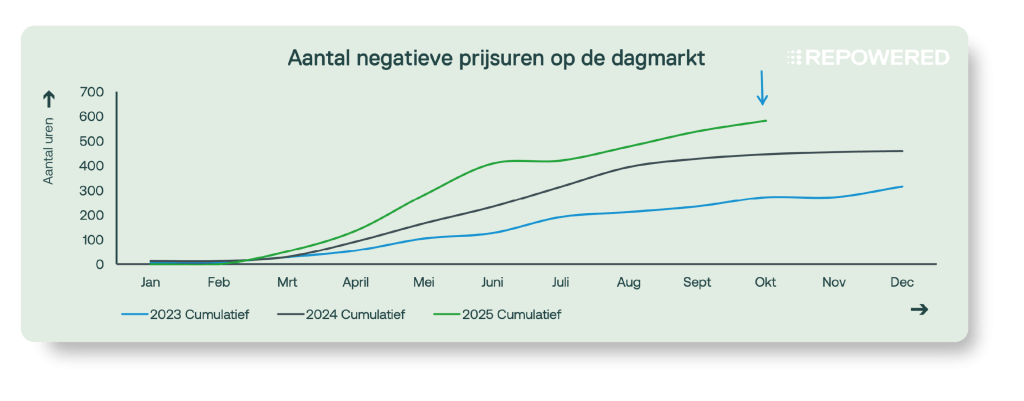
Negative prices
Due to strong winds, the number of hours with negative electricity prices has continued to rise this year (for simplicity’s sake, we’ll continue to count in hours rather than quarters of an hour). This month, there were 43 hours with negative prices, bringing the total for the year to 581 hours.
The imbalance market
In October, the imbalance market was once again calm, with few price spikes. However, there were a few 15-minute periods with high imbalance prices. The proportion of control state 2 was also high again.
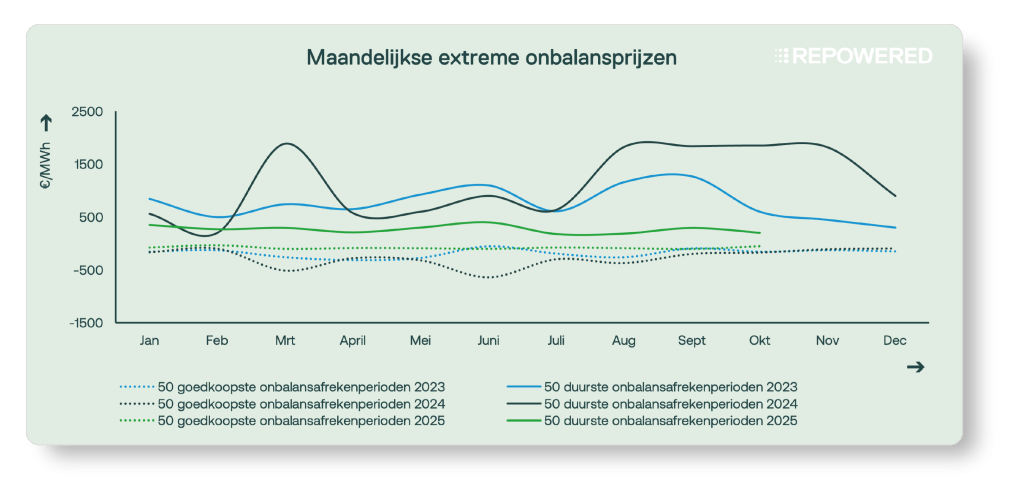
Extreme imbalance prices
Exactly one year after the Netherlands joined PICASSO, we can see that the partnership is having the desired effect. The graph shows that since last October, when PICASSO was introduced, the number of instances of high imbalance prices has decreased significantly. Thanks to PICASSO, less Dutch balancing capacity needs to be deployed, leading to lower imbalance prices.
What exactly is PICASSO?
PICASSO is a European partnership aimed at making aFRR balancing more efficient and less costly. Markets for balancing capacity are being better coordinated so that flexibility can be optimally utilized throughout Europe.
The goal: collaboration that adds value for everyone—from grid operators and balancing service providers to the energy system as a whole.
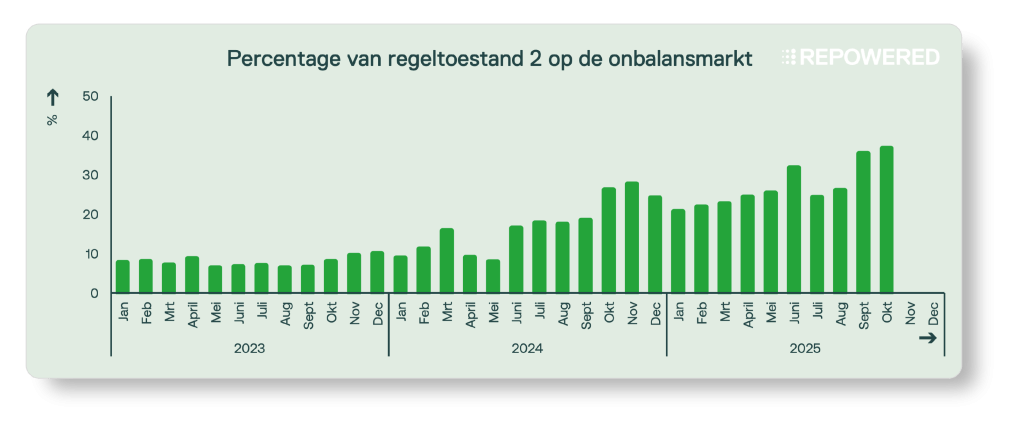
Control Mode 2
Although PICASSO is having the desired effect, the number of quarter-hours with control status 2 remains high : last month, it was 36%. Since October 2024, when the Netherlands joined PICASSO, there has not been a single month in which the number of quarters with control state 2 fell below 20%. This high number of balance fluctuations in the system is undesirable. That is why TenneT is (still) looking into how this can be improved.
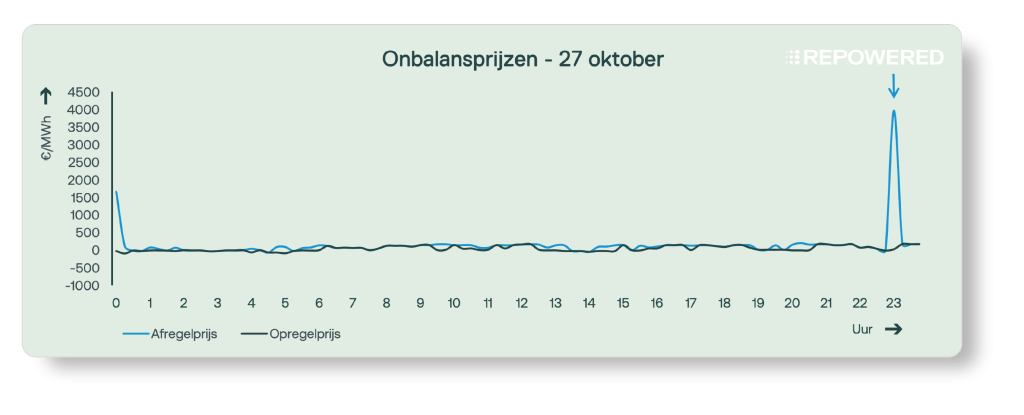
Significant fluctuations in the balance sheet: October 27
This month saw a number of significant fluctuations in the system balance. This resulted in some high imbalance prices. For example, imbalance prices peaked at around €4,000/MWh on October 23 and 27, with the peak on the 27th ending in control state 2. The balance delta shows that the system had a small surplus of approximately 100 MW around 1:30 PM. This was addressed by curtailing generation, reducing grid consumption, or charging batteries, causing the balance to quickly shift to a deficit of 500 MW. A large portion of the aFRR capacity had to be deployed to absorb this sudden deficit. Due to the surplus at the beginning of the quarter-hour and the subsequent deficit within the same quarter-hour, control state 2 was therefore in effect.
Withdrawal price:The imbalance charge for withdrawal. When there is a surplus in the system, there is a price incentive to supply less or consume more.
Market Outlook
Effective November 10, 2025
aFRR blocks reduced from 24 hours to 4 hours
The blocks for automatic frequency restoration (aFRR) are getting shorter: from 24 hours to 4 hours per block (6 blocks per day). Whereas you previously had to reserve power for 24 hours to respond to aFRR, you will soon be able to do so in shorter blocks. This is more beneficial for batteries, demand response, and renewable generation.
Feeling lost in technical jargon?
Don't worry! We've got a handy glossary ready for you👇