
Market Update | September 2025
Every month, we share the most important developments in the energy market. We explain what the figures mean, identify trends over several months and years, and provide insight into how the market affects your energy bill.
September: Every Day Is Different
September is a transitional month in the energy market. Hourly prices on the day-ahead market are heavily influenced by daily weather fluctuations. Accurate forecasts are therefore essential for mitigating risks and capitalizing on opportunities. To gain a clear understanding of the energy market this month, we’ll focus on the daily situation rather than on averages.
September was a record-breaking month; there were extremely high and low prices, three six-hour blocks with negative prices within just 40 hours, and a record number of quarter-hours with control state 2.
The day-ahead market
Many hours of negative prices from both solar and wind energy, extremely high prices in the evening due to high demand and low supply of renewable energy, and significant price fluctuations within a matter of hours. Those who can use their energy flexibly were able to take full advantage of this month’s volatility.
Daily Market Prices
In September, solar and wind energy production fluctuated significantly. During periods of strong winds and sunny weather, we saw extremely low prices. During periods with no solar energy and little wind, prices were high. For example, prices were high in the early evening on September 8, 9, 10, and 19, while they were low in the middle of the day and at night from September 11 through 18. On these days, the wind kept prices low even in the evening, even after sunset.
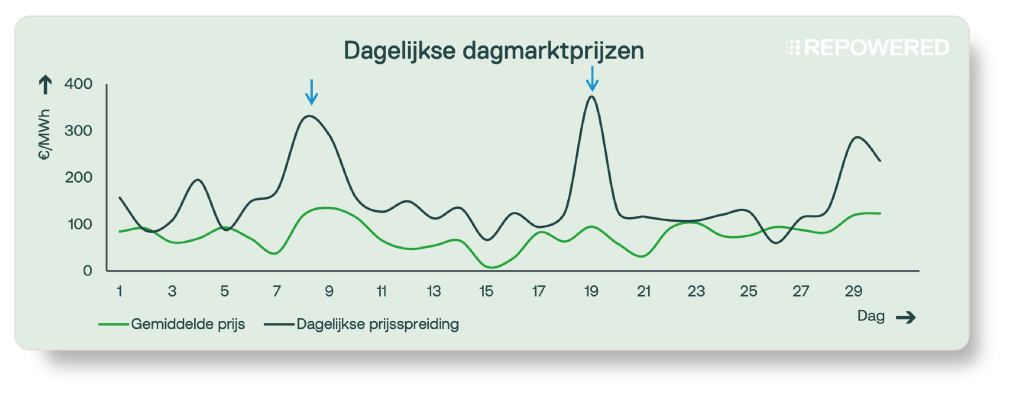
The daily price spread is the difference between the highest and lowest hourly prices on a given day. When the spread is large, the earning potential of batteries is high, because electricity can then be purchased cheaply (charging) and sold at a high price (discharging).
Negative prices
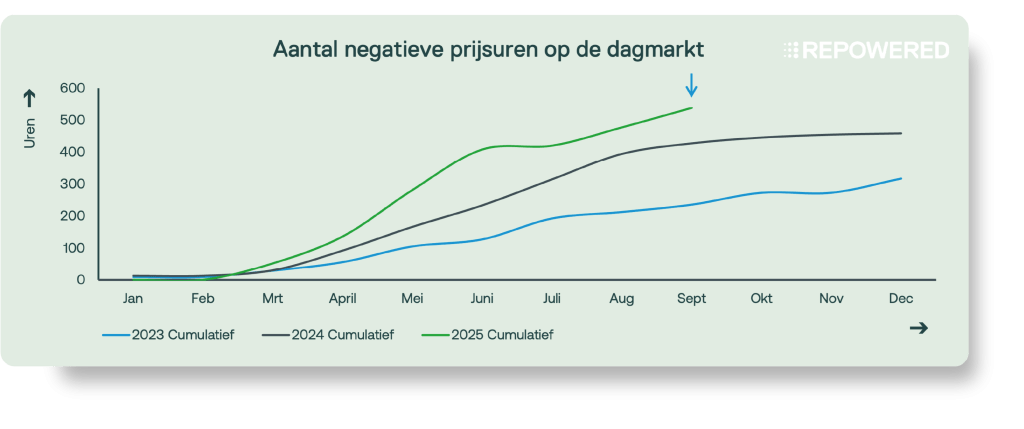
Negative prices occur when there is a surplus of solar and/or wind energy. In September, there were 61 hours with negative prices. On September 15 and 16, there were three six-hour blocks of negativeprices within a 40-hour period.¹ This was due to sunny weather during the day and strong winds at night.
The total number of hours with negative prices continues to rise, even as we move into fall, and is surpassing the records set in previous years. As of the end of September, this year’s total stands at 538 hours with negative prices.
1If the electricity price on the day-ahead market is negative for 6 consecutive hours or longer, no subsidy will be paid for the energy generated during those hours (applies to the SDE++ subsidy starting in 2016). For subsidy decisions issued starting in 2023, no subsidy will be paid for any hours with negative prices.
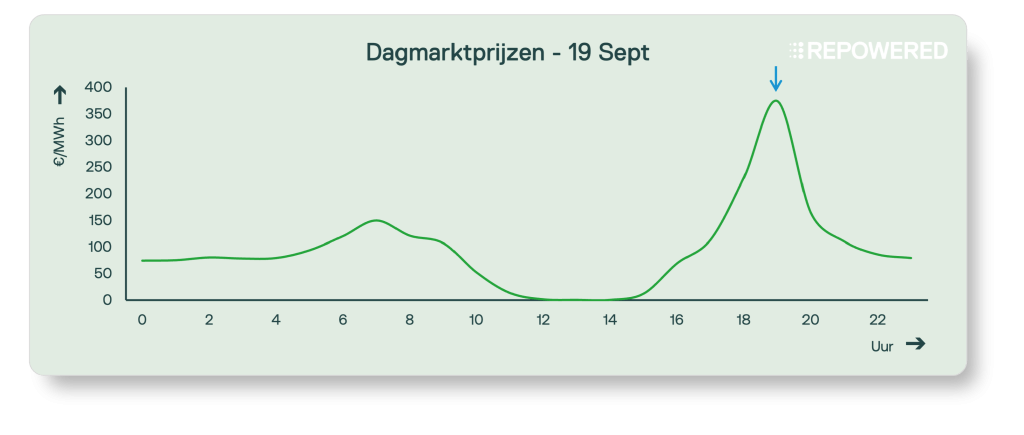
Example of peak prices: September 19
On three occasions this month, evening prices exceeded 300 €/MWh, with the highest peak occurring on September 19. After a sunny day, the price rose from €0 at 2:00 p.m. to 374 €/MWh at 7:00 p.m.
Now that the days are getting shorter, solar energy output during the evening peak is declining—precisely when demand is rising. If there is no wind, prices rise rapidly. Gas-fired power plants, which are shut down on sunny days, must then be brought online quickly. The startup costs drive prices up significantly.
As September comes to a close,the day marketwillswitch from hourly to quarterly pricing.This is an important step toward more accurate pricing that better reflects current supply and demand.
The imbalance market
A record price for ramp-up and a record number of ISPs (quarters) with control status 2. Despite these extremes, this year’s trend of relatively low prices compared to previous years continues.
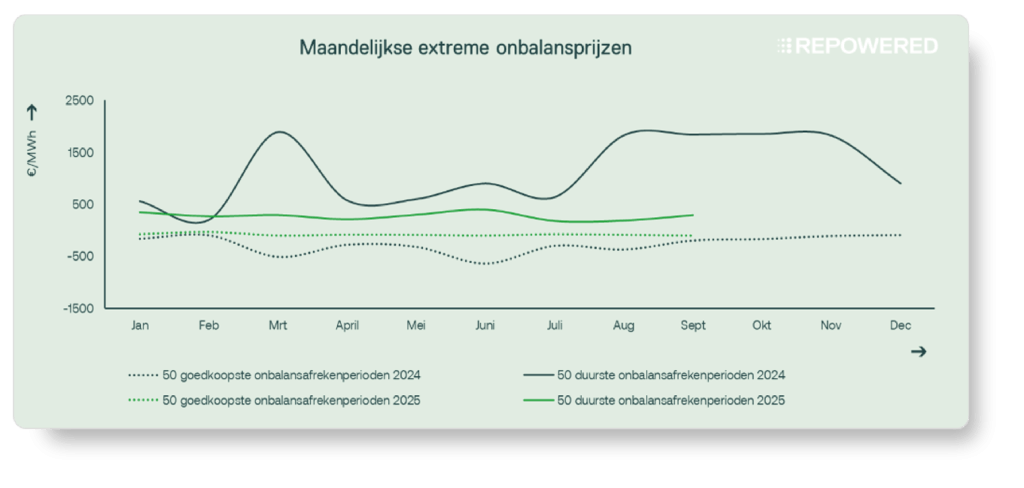
Monthly Extreme Imbalance Prices
In September, several ISPs charged extremely high prices for ramping without control state 2. As a result, discharging a battery at the right time was very profitable. For example, on September 21, the price was 3,970 €/MWh for two quarters. On September 25, it was as high as 5,550 €/MWh: a new record!
Apart from these exceptional spikes, prices were comparable to those seen during the rest of the year. European cooperation through PICASSO andIGCC2 usually prevents extreme national price fluctuations.
2 PICASSO and IGCC are partnerships between European countries aimed at efficiently and effectively allocating the use of balancing reserves across national borders.
Record imbalance price – September 25
Despite European partnerships through PICASSO and IGCC, the Netherlands’ entire aFRR capacity has been utilized on multiple occasions, resulting in extreme prices.
This illustrates just how complex the market is. In general, European cooperation helps prevent high aFRR activations by pooling balancing resources across borders. Nevertheless, serious imbalances can still arise—either locally or elsewhere in Europe—requiring all of the Netherlands’ aFRR capacity to restore balance.
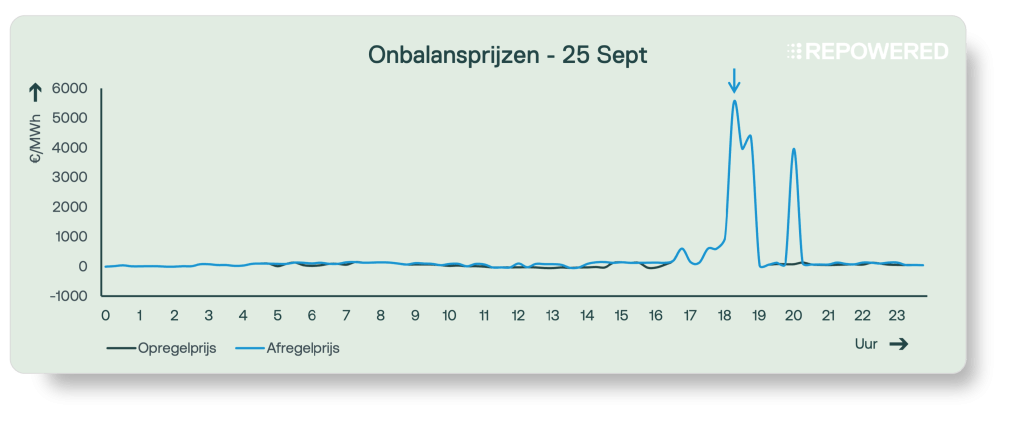
Withdrawal price:The imbalance charge for withdrawal. When there is a surplus in the system, there is a price incentive to supply less or consume more.
Control Mode 2 (CM2)
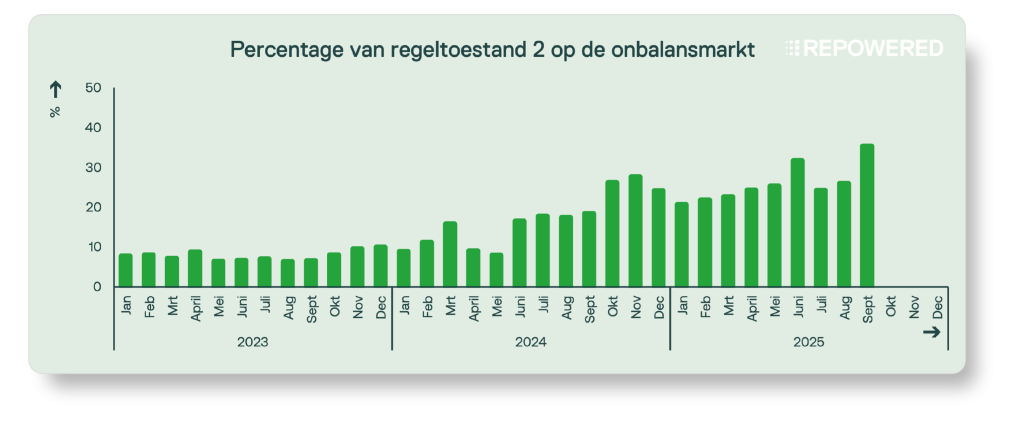
In September, control state 2 (RT2) reached a record high in the Netherlands. Since the launch of PICASSO in October 2024, RT2 has occurred in more than 20% of the quarters. Last September, control state 2 was observed in 35 percent of the ISPs.
Although the total number of RT2 events is increasing, the pattern remains familiar: most RT2 events occur during the morning and evening peak periods, especially in the first quarter-hour of each hour when power shortages are most likely to occur. Thanks to PICASSO’s real-time, cross-border activation every 4 seconds, the system responds more quickly to grid imbalances than before. As a result, the system also appears to have become more sensitive to rapid changes in the balance delta—and thus to rapid price fluctuations and RT2.
A common strategy for mitigating the risk of RT2 is to trade the imbalance position on the ex-post market.
Market Outlook
October 1, 2025
Day-Ahead Market: From Hourly to Quarter-Hourly
As of October 1, 2025, the Day-Ahead market has switched from hourly prices to quarter-hourly prices. Inthis article, you can read about what this change means. In the October market update, we take an in-depth look at the impact of this change.
October 18, 2025
PICASSO’s anniversary🎂
On October 18, 2024, PICASSO went live in the Netherlands. PICASSO integrates automatic frequency restoration reserves (aFRR) at the European level, selecting the most cost-effective bids. This European collaboration makes the market more efficient and reduces extreme price spikes. This results in a more affordable energy system, but also in lower earning potential.
Effective November 10, 2025
aFRR blocks reduced from 24 hours to 4 hours
The blocks for automatic frequency restoration (aFRR) are getting shorter: from 24 hours to 4 hours per block (6 blocks per day). Whereas you previously had to reserve power for 24 hours to respond to aFRR, you will soon be able to do so in shorter blocks. This is more beneficial for batteries, demand response, and renewable generation.
Feeling lost in technical jargon?
Don't worry! We've got a handy glossary ready for you👇